Line Background Estimation Using Adjacent Energy Bins
H.Yoneda, S. Mittal
This is a tutorial notebook on background estimation for gamma-ray lines. The basic idea is as follows:
Extracting the event distribution in the Compton data space from adjacent energy bins of the energy of interest.
Making a binned histogram using the extracted events.
Estimate the total number of expected background counts in the line energy bin by fitting the adjacent energy bin data, and modify the normalization of the binned histogram accordingly.
Here, we make a background model for Al-26. These processes will be performed in the LineBackgroundEstimation class, and you can see how it works as follows.
This class is very preliminary, and there are several areas for improvement. Future ideas include:
We may add more options in the minuit fitting, e.g., limiting the parameter region, fixing some parameters.
We may apply smoothing to the background histogram, which may help to mitigate Poisson fluctuation in the model.
[1]:
import logging
import sys
logger = logging.getLogger('cosipy')
logger.setLevel(logging.INFO)
logger.addHandler(logging.StreamHandler(sys.stdout))
[2]:
from histpy import Histogram, Axis, Axes
import astropy.units as u
import numpy as np
import matplotlib.pyplot as plt
from scipy.optimize import curve_fit
from scipy import integrate
from iminuit import Minuit
from cosipy import BinnedData, LineBackgroundEstimation

from cosipy.util import fetch_wasabi_file
from pathlib import Path
import healpy as hp
20:29:43 WARNING   The naima package is not available. Models that depend on it will not be         functions.py:48
                  available
         WARNING   The GSL library or the pygsl wrapper cannot be loaded. Models that depend on it  functions.py:69
                  will not be available.
20:29:44 WARNING   The ebltable package is not available. Models that depend on it will not be     absorption.py:33
                  available
INFO Starting 3ML! __init__.py:39
WARNING WARNINGs here are NOT errors __init__.py:40
WARNING but are inform you about optional packages that can be installed __init__.py:41
WARNING to disable these messages, turn off start_warning in your config file __init__.py:44
20:29:44 WARNING ROOT minimizer not available minimization.py:1345
WARNING Multinest minimizer not available minimization.py:1357
WARNING PyGMO is not available minimization.py:1369
         WARNING   The cthreeML package is not installed. You will not be able to use plugins which  __init__.py:94
                  require the C/C++ interface (currently HAWC)
         WARNING   Could not import plugin HAWCLike.py. Do you have the relative instrument         __init__.py:144
                  software installed and configured?
         WARNING   Could not import plugin FermiLATLike.py. Do you have the relative instrument     __init__.py:144
                  software installed and configured?
WARNING No fermitools installed lat_transient_builder.py:44
         WARNING   Env. variable OMP_NUM_THREADS is not set. Please set it to 1 for optimal         __init__.py:387
                  performances in 3ML
         WARNING   Env. variable MKL_NUM_THREADS is not set. Please set it to 1 for optimal         __init__.py:387
                  performances in 3ML
         WARNING   Env. variable NUMEXPR_NUM_THREADS is not set. Please set it to 1 for optimal     __init__.py:387
                  performances in 3ML
[3]:
%matplotlib inline
%config InlineBackend.figure_format='retina'
0. Create dataset for the line background estimation
We need an event histogram binned finely along the energy axis.
[4]:
# Change to your path
data_path = Path("")

Al_file = "26Al_NE2001_3months_unbinned_data_filtered_with_SAAcut.fits.gz"
bkg_file = "PrimaryProtons_3months_unbinned_data_filtered_with_SAAcut.fits.gz"
[5]:
# Download files if needed
fetch_wasabi_file("COSI-SMEX/DC3/Data/Sources/"+Al_file, checksum = 'add408aae70caf59789c82b31020564a')
fetch_wasabi_file("COSI-SMEX/DC3/Data/Backgrounds/Ge/"+bkg_file, checksum = '3264e6bf520f4c20e06aaaed5d57abf0')
A file named 26Al_NE2001_3months_unbinned_data_filtered_with_SAAcut.fits.gz already exists with the specified checksum (add408aae70caf59789c82b31020564a). Skipping.
A file named PrimaryProtons_3months_unbinned_data_filtered_with_SAAcut.fits.gz already exists with the specified checksum (3264e6bf520f4c20e06aaaed5d57abf0). Skipping.
[6]:
path_to_Al  = data_path/Al_file
path_to_bkg = data_path/bkg_file
[7]:
#yaml files containing binning information
spectrum_bkg = BinnedData("inputs_bkg_estimation.yaml")
spectrum_Al = BinnedData("inputs_bkg_estimation.yaml")
[8]:
%%time
#path to unbinned fits file for source and background to create binned dataset
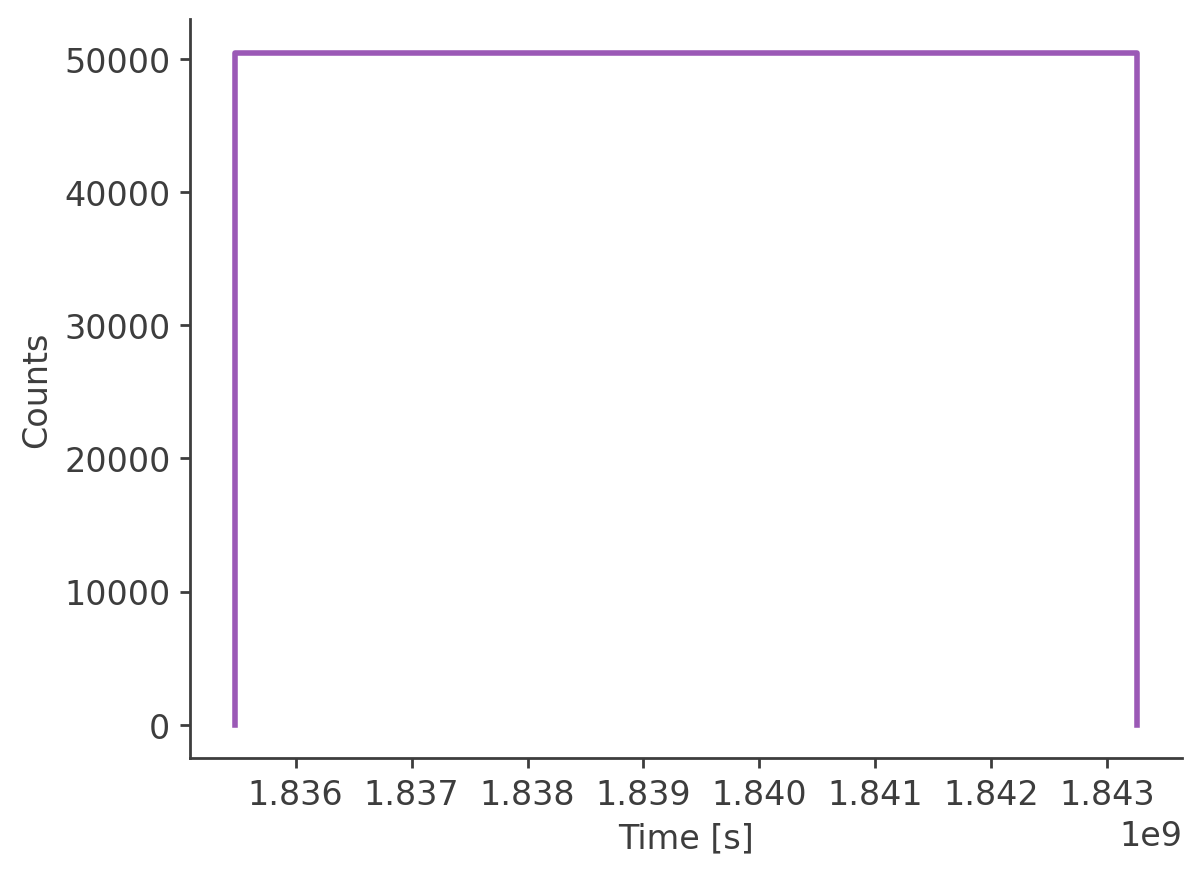
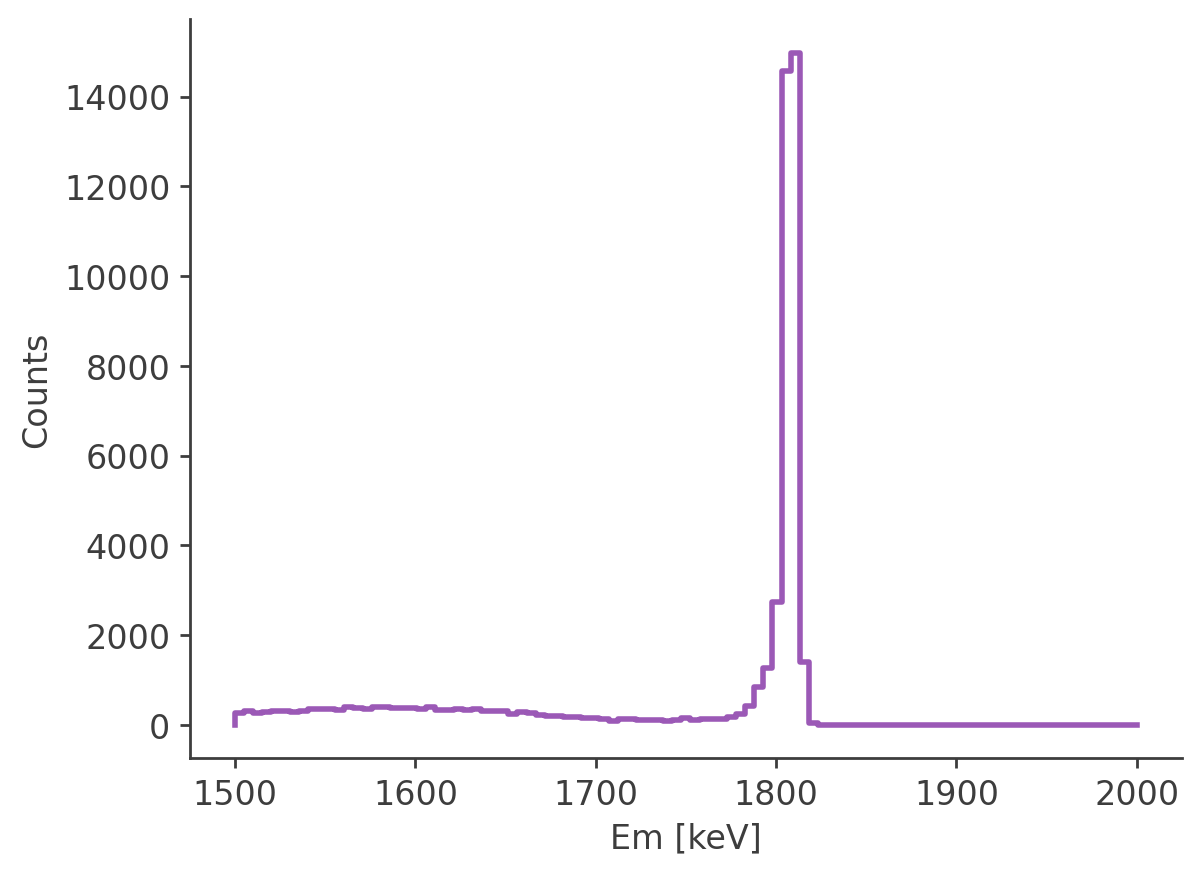
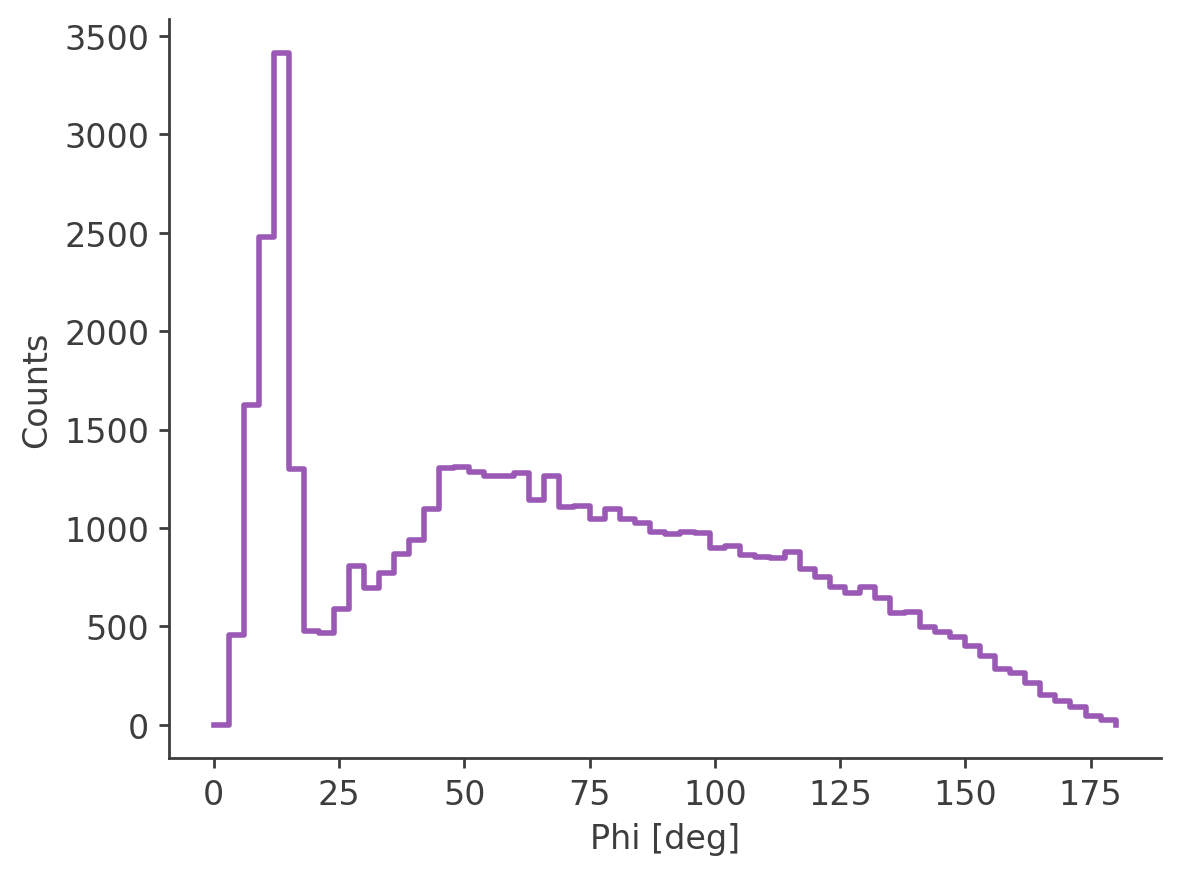
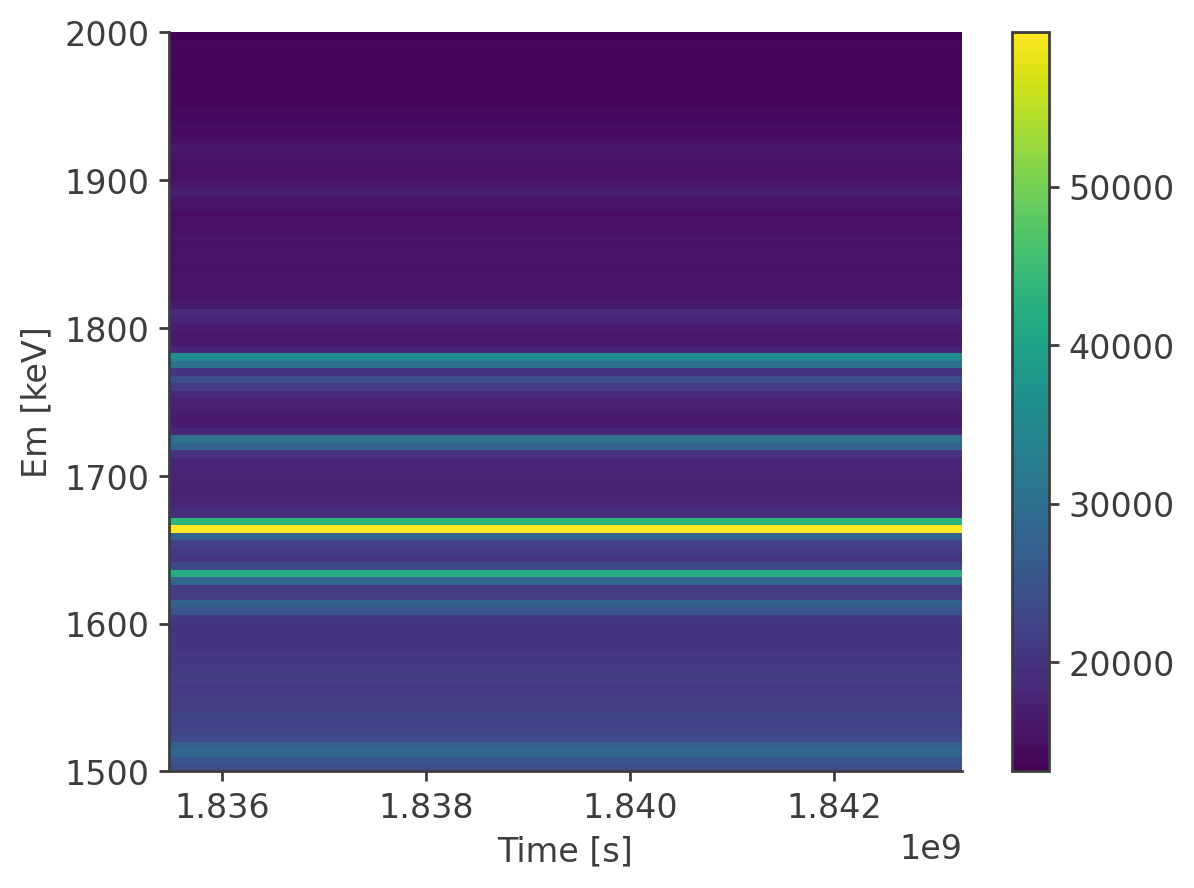
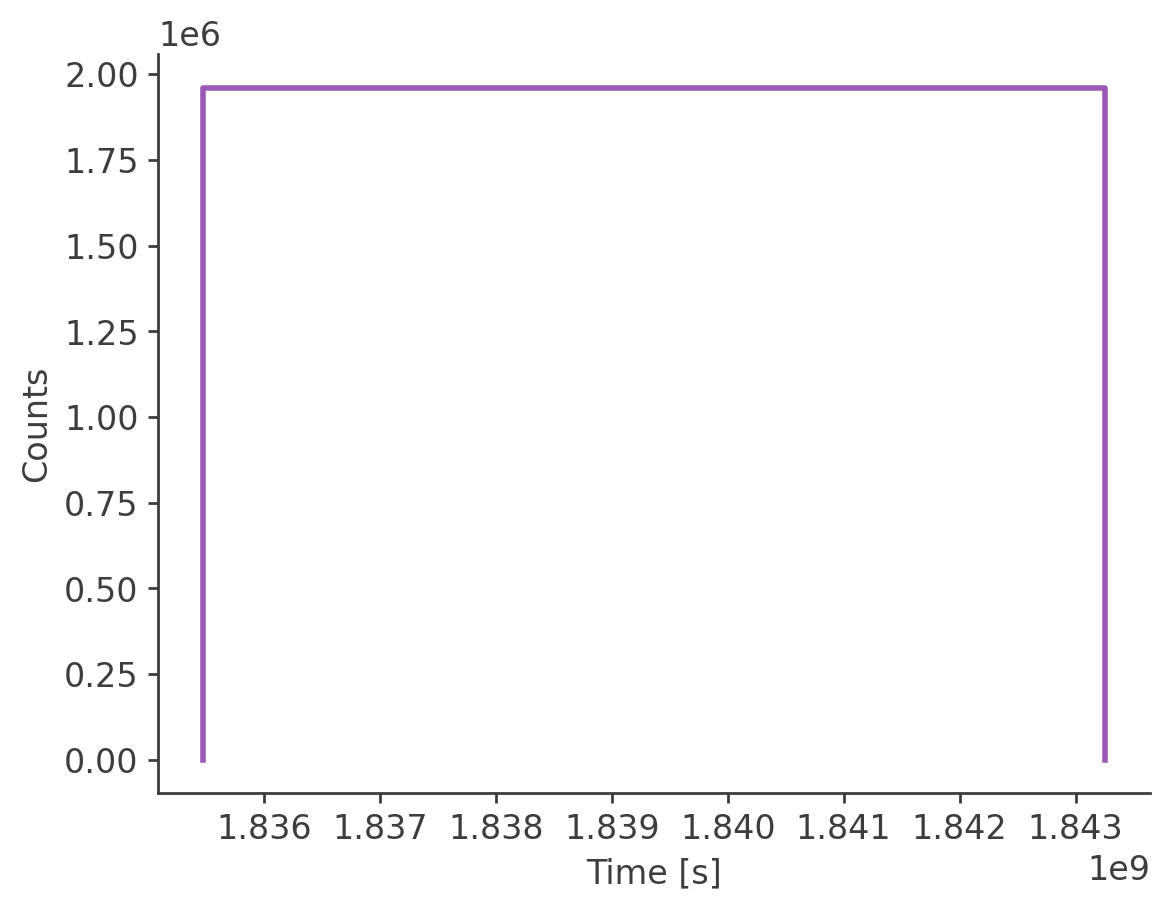
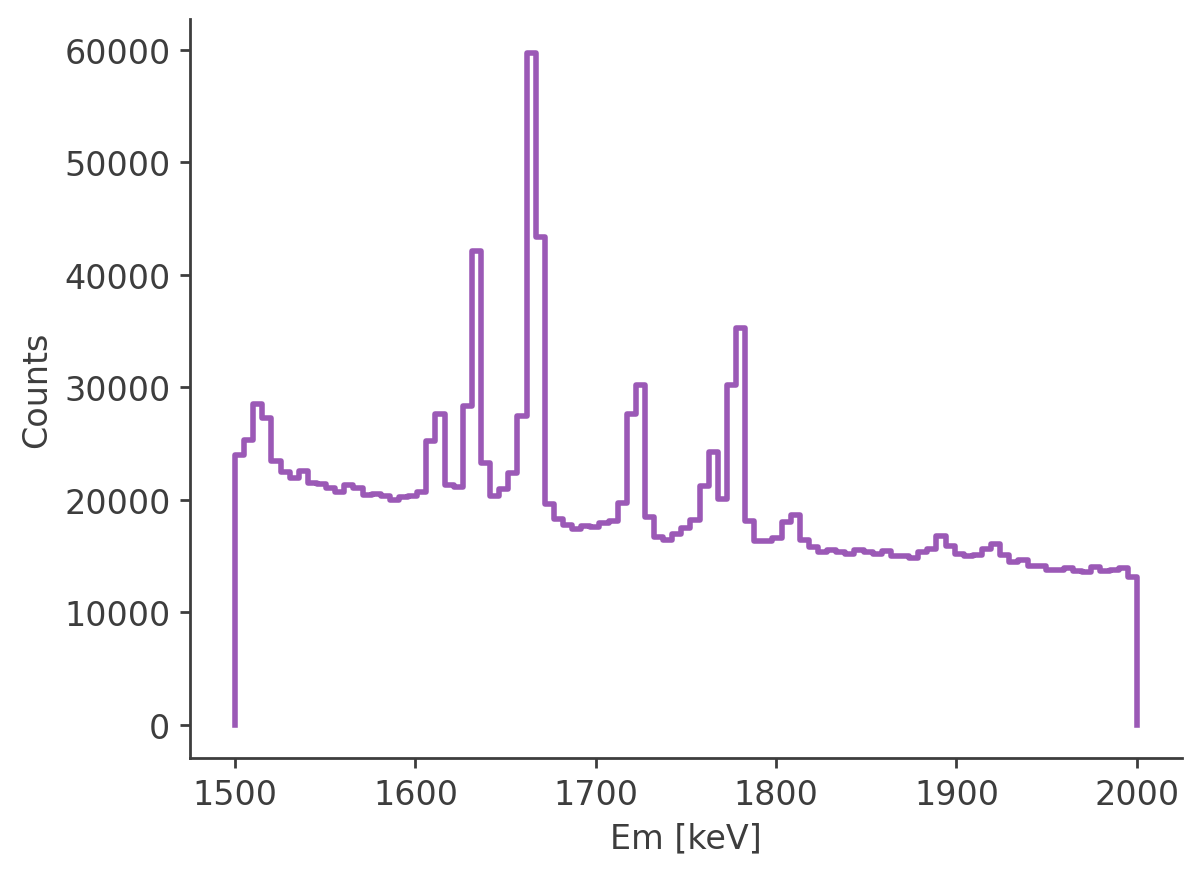
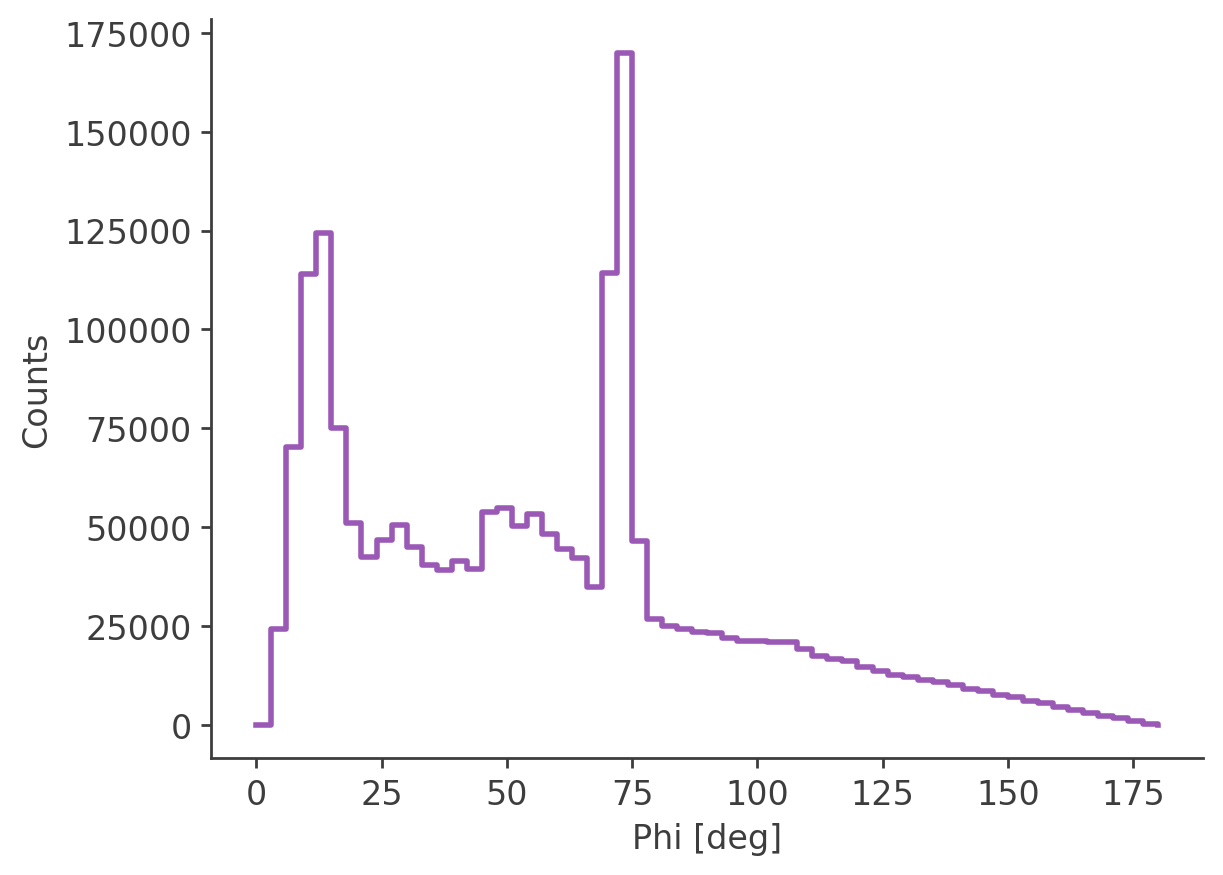
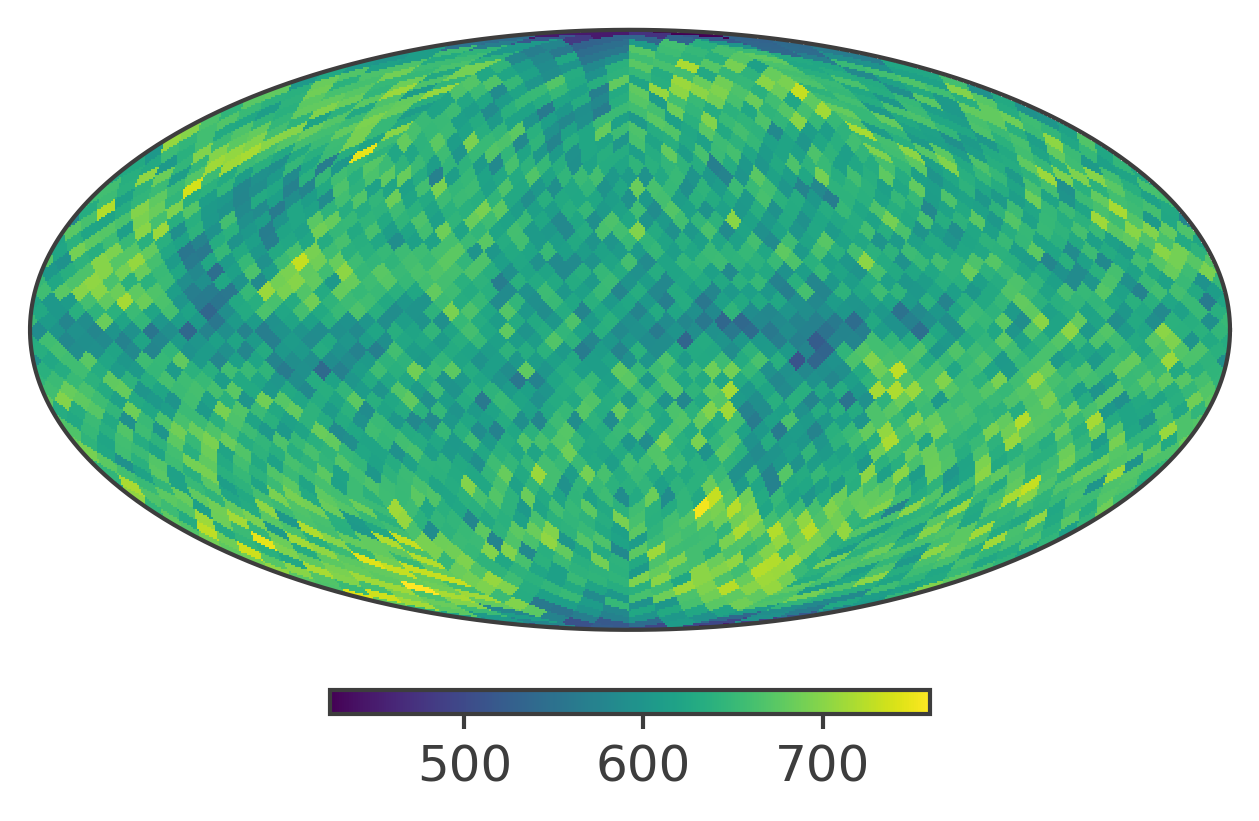
spectrum_Al.get_binned_data(unbinned_data=path_to_Al, make_binning_plots=True,
output_name='Al_binned', show_plots=True)
binning data...
fill() discarded one or more values due to out-of-bounds coordinate in a dimension without under/overflow tracking
Time unit: s
Em unit: keV
Phi unit: deg
PsiChi unit: None
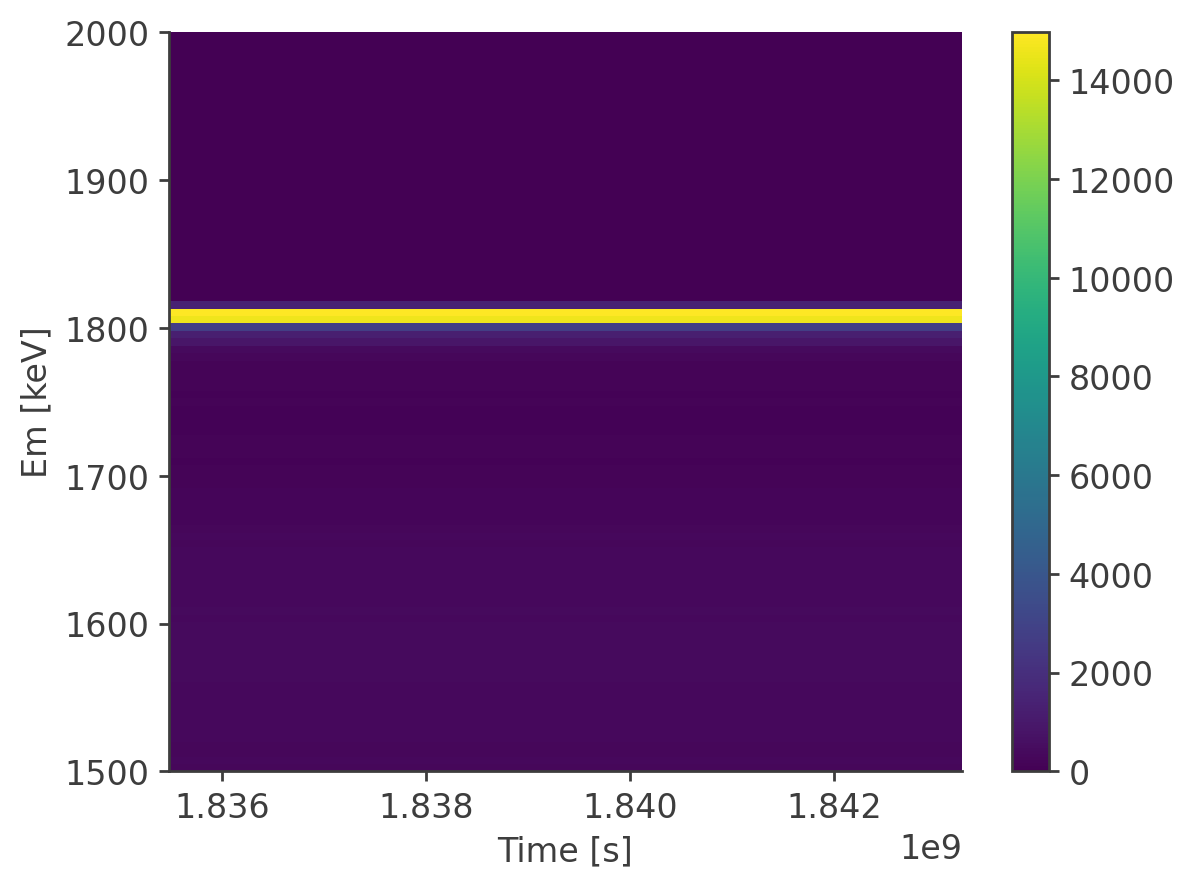
plotting psichi map in galactic...
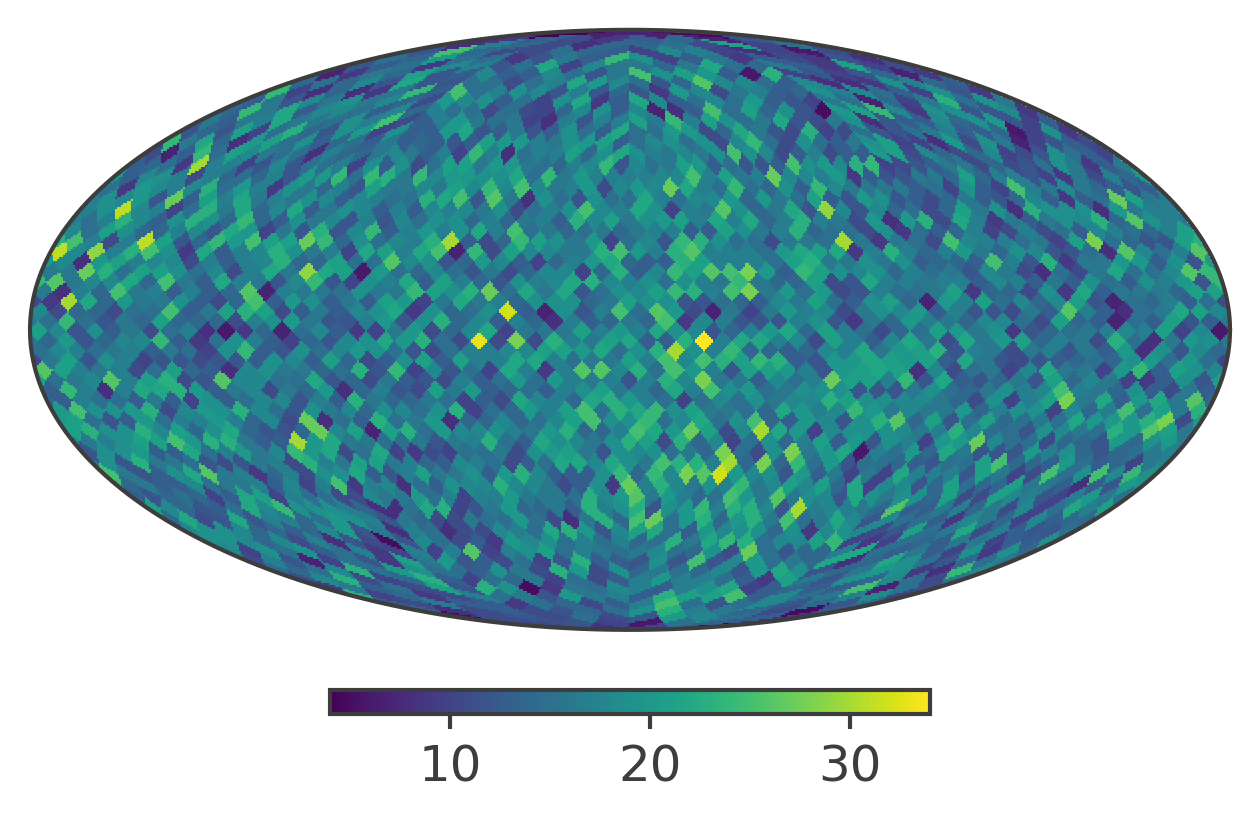
CPU times: user 3.24 s, sys: 81.2 ms, total: 3.33 s
Wall time: 1.47 s
[9]:
%%time

#path to unbinned fits file for source and background to create binned dataset
spectrum_bkg.get_binned_data(unbinned_data=path_to_bkg, make_binning_plots=True,
            output_name='bkg_binned', show_plots=True)
binning data...
fill() discarded one or more values due to out-of-bounds coordinate in a dimension without under/overflow tracking
Time unit: s
Em unit: keV
Phi unit: deg
PsiChi unit: None
plotting psichi map in galactic...
CPU times: user 30.2 s, sys: 2.61 s, total: 32.8 s
Wall time: 30.2 s
[10]:
#combine source and background binned data
spectrum_total = spectrum_Al.binned_data + spectrum_bkg.binned_data
spectrum_total.write('combined_al_bkg_nside_16.hdf5')
This spectrum_total can be considered as the actual event histogram in COSI observations.
[11]:
# load data
spectrum_bkg = Histogram.open("bkg_binned.hdf5")
spectrum_Al = Histogram.open("Al_binned.hdf5")
spectrum_total = Histogram.open("combined_al_bkg_nside_16.hdf5")
1. Instantiate the LineBackgroundEstimation
[12]:
instance = LineBackgroundEstimation(spectrum_total)
2. Set background model and fit it
Define a background spectrum model for fitting data
[13]:
def powerlaw(x, a, b, pivot):
    return a * (x/pivot)**b

def gaussian(x, a, mu, sigma):
    return a / (sigma) / np.sqrt(2 * np.pi) * np.exp( -(x-mu)**2 / (2*sigma**2))

def bkg_model(x, a, b, a1, mu1, a2, mu2, a3, mu3, a4, mu4, a5, mu5, a6, mu6, sigma):
    pivot = 1800.0
    return powerlaw(x,a,b, pivot) + \
            gaussian(x , a1, mu1, sigma) + \
            gaussian(x , a2, mu2, sigma) + \
            gaussian(x , a3, mu3, sigma) + \
            gaussian(x , a4, mu4, sigma) + \
            gaussian(x , a5, mu5, sigma) + \
            gaussian(x , a6, mu6, sigma)
[14]:
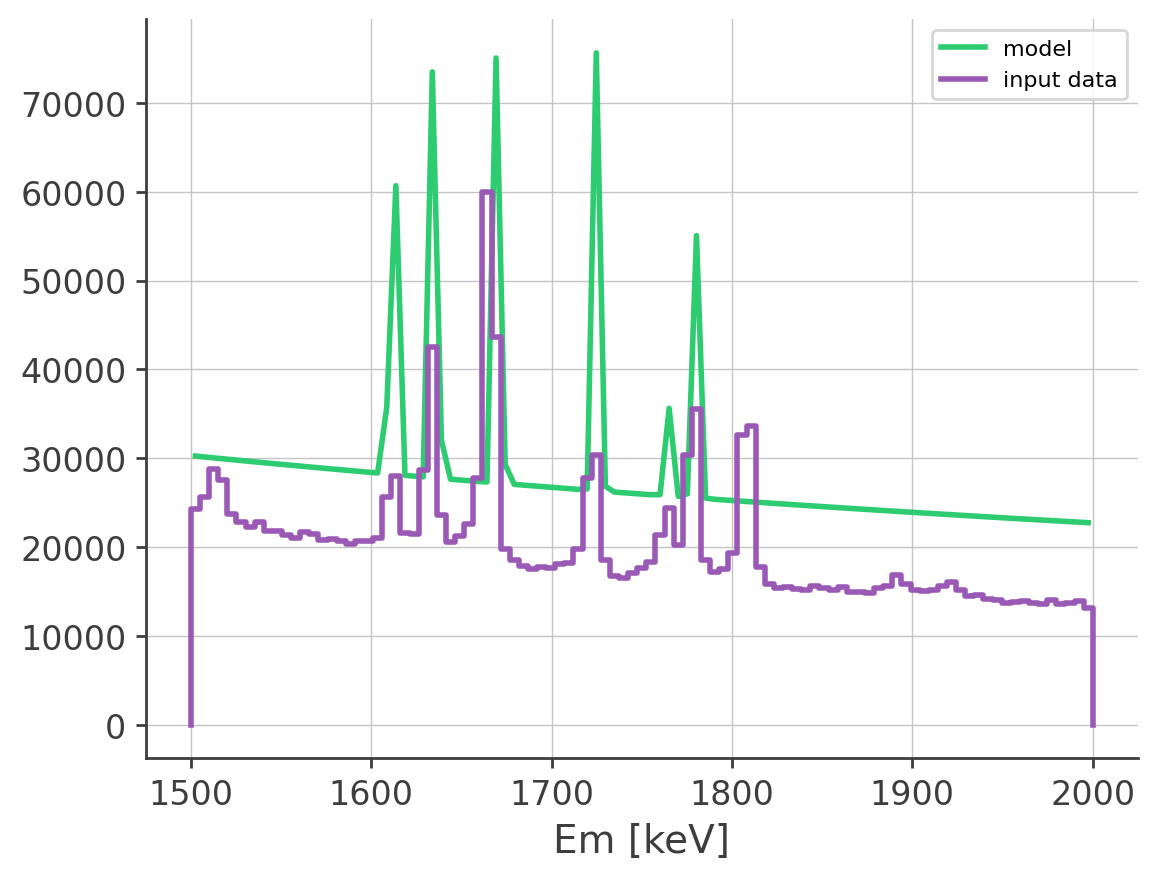
instance.set_bkg_energy_spectrum_model(bkg_model, [5000.0, -1.0, 40000.0, 1612, 50000.0, 1635, 50000.0, 1670, 50000.0, 1725, 10000.0, 1765, 30000.0, 1780, 1.0])
instance.plot_energy_spectrum()
[14]:
(<Axes: xlabel='Em [keV]'>, <ErrorbarContainer object of 3 artists>)
[15]:
param_limits = {3: (1600, 1620), 5: (1620, 1640), 7: (1650, 1675), 9: (1700, 1730), 11: (1750, 1770), 13:(1770, 1790),
                4: (0, None), 6: (0, None), 8: (0, None), 10: (0, None), 12: (0, None), 14: (0, None)}
[16]:
%%time

m = instance.fit_energy_spectrum(param_limits = param_limits)
m
CPU times: user 1min 58s, sys: 320 ms, total: 1min 59s
Wall time: 1min 59s
[16]:
| Migrad | |
|---|---|
| FCN = -1.802e+07 | Nfcn = 5503 |
| EDM = 0.000521 (Goal: 0.0001) | |
| Valid Minimum | Below EDM threshold (goal x 10) |
| No parameters at limit | Below call limit |
| Hesse ok | Covariance accurate |
| Name | Value | Hesse Error | Minos Error- | Minos Error+ | Limit- | Limit+ | Fixed | |
|---|---|---|---|---|---|---|---|---|
| 0 | x0 | 3.4553e3 | 0.0030e3 | |||||
| 1 | x1 | -1.964 | 0.009 | |||||
| 2 | x2 | 10.29e3 | 0.24e3 | |||||
| 3 | x3 | 1.611173e3 | 0.000021e3 | 1.6E+03 | 1.62E+03 | |||
| 4 | x4 | 24.04e3 | 0.26e3 | 0 | ||||
| 5 | x5 | 1.63612e3 | 0.00008e3 | 1.62E+03 | 1.64E+03 | |||
| 6 | x6 | 63.02e3 | 0.33e3 | 0 | ||||
| 7 | x7 | 1.666601e3 | 0.000022e3 | 1.65E+03 | 1.68E+03 | |||
| 8 | x8 | 11.39e3 | 0.17e3 | 0 | ||||
| 9 | x9 | 1.7264e3 | 0.0017e3 | 1.7E+03 | 1.73E+03 | |||
| 10 | x10 | 9.39e3 | 0.21e3 | 0 | ||||
| 11 | x11 | 1.762713e3 | 0.000029e3 | 1.75E+03 | 1.77E+03 | |||
| 12 | x12 | 30.21e3 | 0.26e3 | 0 | ||||
| 13 | x13 | 1.777822e3 | 0.000015e3 | 1.77E+03 | 1.79E+03 | |||
| 14 | x14 | 0.20 | 0.07 | 0 |
| x0 | x1 | x2 | x3 | x4 | x5 | x6 | x7 | x8 | x9 | x10 | x11 | x12 | x13 | x14 | |
|---|---|---|---|---|---|---|---|---|---|---|---|---|---|---|---|
| x0 | 9.02 | 11.87e-3 (0.440) | -56 (-0.079) | 0.1e-3 (0.001) | -66 (-0.085) | -0.000 | -68 (-0.070) | 0.2e-3 (0.003) | -43 (-0.083) | 0 (-0.001) | -86 (-0.136) | 0.5e-3 (0.005) | -93 (-0.120) | -0.05e-3 (-0.001) | -0.001 (-0.004) |
| x1 | 11.87e-3 (0.440) | 8.07e-05 | 239.00e-3 (0.113) | -0 (-0.012) | 170.89e-3 (0.074) | 0.01e-3 (0.007) | 107.10e-3 (0.037) | 0 (0.004) | 3.57e-3 (0.002) | 0.01e-3 | -60.19e-3 (-0.032) | -0 (-0.002) | -83.38e-3 (-0.036) | -0 (-0.003) | -0 (-0.003) |
| x2 | -56 (-0.079) | 239.00e-3 (0.113) | 5.55e+04 | -297.7e-3 (-0.059) | 0 (0.027) | 0.080 (0.004) | 0 (0.018) | 15.2e-3 (0.003) | 0.001e6 (0.013) | 0.3 (0.001) | 0 (0.016) | -26.2e-3 (-0.004) | 0 (0.012) | -10.38e-3 (-0.003) | -0.042 (-0.003) |
| x3 | 0.1e-3 (0.001) | -0 (-0.012) | -297.7e-3 (-0.059) | 0.000452 | -110.8e-3 (-0.020) | -1.7e-3 (-0.956) | -6.3e-3 (-0.001) | -0.4e-3 (-0.957) | -10.2e-3 (-0.003) | -6.8e-3 (-0.182) | 78.0e-3 (0.017) | 0.6e-3 (0.935) | 152.4e-3 (0.028) | 0.29e-3 (0.948) | 1.3e-3 (0.959) |
| x4 | -66 (-0.085) | 170.89e-3 (0.074) | 0 (0.027) | -110.8e-3 (-0.020) | 6.7e+04 | 1.141 (0.054) | -0 (-0.014) | 106.4e-3 (0.019) | 0.002e6 (0.045) | 2.3 (0.005) | 0 (0.035) | -153.5e-3 (-0.020) | 0 (0.037) | -72.99e-3 (-0.019) | -0.323 (-0.019) |
| x5 | -0.000 | 0.01e-3 (0.007) | 0.080 (0.004) | -1.7e-3 (-0.956) | 1.141 (0.054) | 0.00664 | -0.014 (-0.001) | 1.8e-3 (0.995) | 0.054 (0.004) | 0.027 (0.190) | -0.304 (-0.018) | -2.3e-3 (-0.973) | -0.594 (-0.028) | -1.17e-3 (-0.986) | -0.005 (-0.997) |
| x6 | -68 (-0.070) | 107.10e-3 (0.037) | 0 (0.018) | -6.3e-3 (-0.001) | -0 (-0.014) | -0.014 (-0.001) | 1.06e+05 | 42.3e-3 (0.006) | 0.002e6 (0.029) | 1.5 (0.003) | 0 (0.012) | -4.4e-3 (-0.000) | 0 (0.009) | 0.57e-3 | 0.008 (0.000) |
| x7 | 0.2e-3 (0.003) | 0 (0.004) | 15.2e-3 (0.003) | -0.4e-3 (-0.957) | 106.4e-3 (0.019) | 1.8e-3 (0.995) | 42.3e-3 (0.006) | 0.000473 | 8.5e-3 (0.002) | 7.2e-3 (0.190) | -87.4e-3 (-0.019) | -0.6e-3 (-0.974) | -166.3e-3 (-0.030) | -0.31e-3 (-0.987) | -1.4e-3 (-0.998) |
| x8 | -43 (-0.083) | 3.57e-3 (0.002) | 0.001e6 (0.013) | -10.2e-3 (-0.003) | 0.002e6 (0.045) | 0.054 (0.004) | 0.002e6 (0.029) | 8.5e-3 (0.002) | 3.02e+04 | 3.5 (0.012) | 0.001e6 (0.027) | -16.8e-3 (-0.003) | 0.001e6 (0.028) | -6.40e-3 (-0.003) | -0.023 (-0.002) |
| x9 | 0 (-0.001) | 0.01e-3 | 0.3 (0.001) | -6.8e-3 (-0.182) | 2.3 (0.005) | 0.027 (0.190) | 1.5 (0.003) | 7.2e-3 (0.190) | 3.5 (0.012) | 3.04 | -1.2 (-0.003) | -9.5e-3 (-0.185) | -2.4 (-0.005) | -4.79e-3 (-0.188) | -0.022 (-0.190) |
| x10 | -86 (-0.136) | -60.19e-3 (-0.032) | 0 (0.016) | 78.0e-3 (0.017) | 0 (0.035) | -0.304 (-0.018) | 0 (0.012) | -87.4e-3 (-0.019) | 0.001e6 (0.027) | -1.2 (-0.003) | 4.44e+04 | -233.4e-3 (-0.038) | 0 (0.056) | 55.74e-3 (0.018) | 0.268 (0.019) |
| x11 | 0.5e-3 (0.005) | -0 (-0.002) | -26.2e-3 (-0.004) | 0.6e-3 (0.935) | -153.5e-3 (-0.020) | -2.3e-3 (-0.973) | -4.4e-3 (-0.000) | -0.6e-3 (-0.974) | -16.8e-3 (-0.003) | -9.5e-3 (-0.185) | -233.4e-3 (-0.038) | 0.000862 | 202.1e-3 (0.027) | 0.41e-3 (0.964) | 1.9e-3 (0.975) |
| x12 | -93 (-0.120) | -83.38e-3 (-0.036) | 0 (0.012) | 152.4e-3 (0.028) | 0 (0.037) | -0.594 (-0.028) | 0 (0.009) | -166.3e-3 (-0.030) | 0.001e6 (0.028) | -2.4 (-0.005) | 0 (0.056) | 202.1e-3 (0.027) | 6.57e+04 | 57.61e-3 (0.015) | 0.509 (0.030) |
| x13 | -0.05e-3 (-0.001) | -0 (-0.003) | -10.38e-3 (-0.003) | 0.29e-3 (0.948) | -72.99e-3 (-0.019) | -1.17e-3 (-0.986) | 0.57e-3 | -0.31e-3 (-0.987) | -6.40e-3 (-0.003) | -4.79e-3 (-0.188) | 55.74e-3 (0.018) | 0.41e-3 (0.964) | 57.61e-3 (0.015) | 0.000214 | 0.95e-3 (0.989) |
| x14 | -0.001 (-0.004) | -0 (-0.003) | -0.042 (-0.003) | 1.3e-3 (0.959) | -0.323 (-0.019) | -0.005 (-0.997) | 0.008 (0.000) | -1.4e-3 (-0.998) | -0.023 (-0.002) | -0.022 (-0.190) | 0.268 (0.019) | 1.9e-3 (0.975) | 0.509 (0.030) | 0.95e-3 (0.989) | 0.00436 |
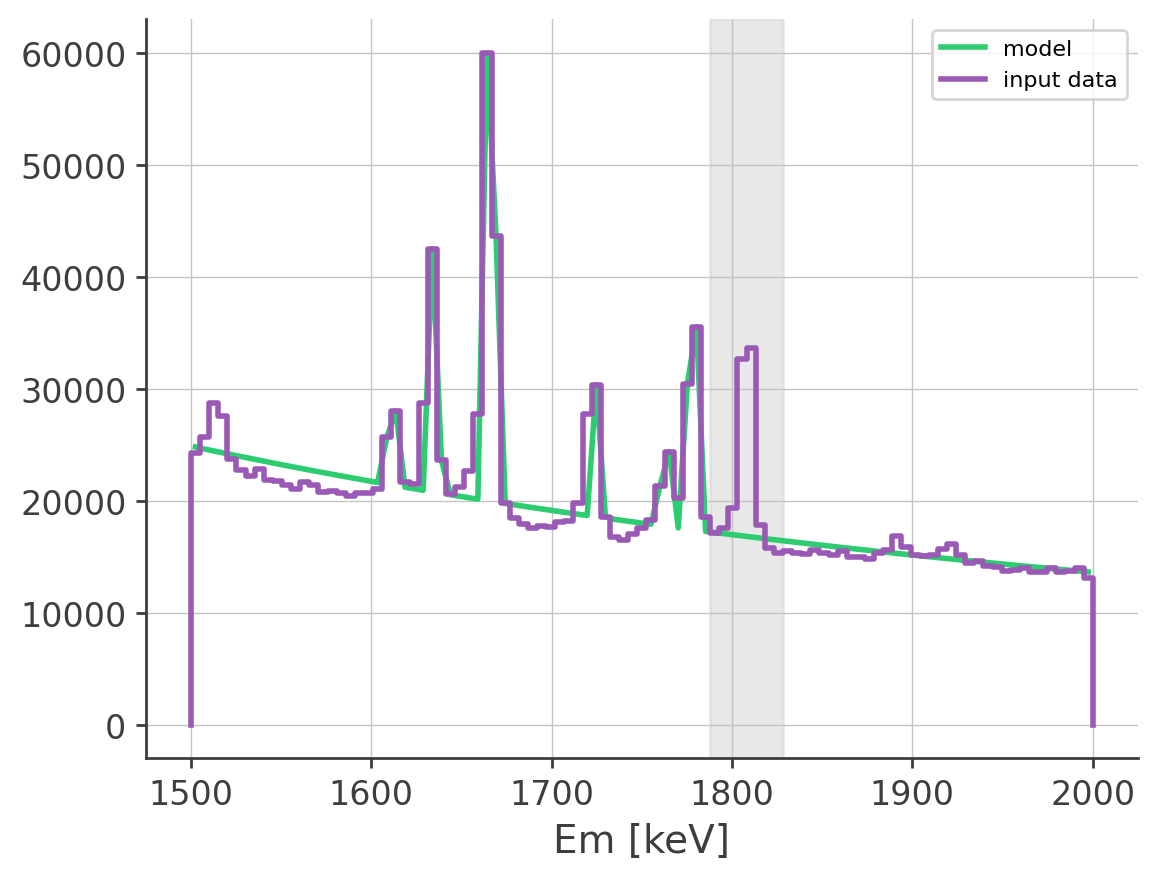
[17]:
ax, _ = instance.plot_energy_spectrum()
Mask a region around Al-26
[18]:
instance.set_mask((1790.0, 1825.0) * u.keV)
instance.mask
[18]:
array([False, False, False, False, False, False, False, False, False,
       False, False, False, False, False, False, False, False, False,
       False, False, False, False, False, False, False, False, False,
       False, False, False, False, False, False, False, False, False,
       False, False, False, False, False, False, False, False, False,
       False, False, False, False, False, False, False, False, False,
       False, False, False,  True,  True,  True,  True,  True,  True,
        True,  True, False, False, False, False, False, False, False,
       False, False, False, False, False, False, False, False, False,
       False, False, False, False, False, False, False, False, False,
       False, False, False, False, False, False, False, False, False])
[19]:
m = instance.fit_energy_spectrum(param_limits = param_limits)
m
[19]:
| Migrad | |
|---|---|
| FCN = -1.651e+07 | Nfcn = 2319 |
| EDM = 2.29e-05 (Goal: 0.0001) | |
| Valid Minimum | Below EDM threshold (goal x 10) |
| No parameters at limit | Below call limit |
| Hesse ok | Covariance accurate |
| Name | Value | Hesse Error | Minos Error- | Minos Error+ | Limit- | Limit+ | Fixed | |
|---|---|---|---|---|---|---|---|---|
| 0 | x0 | 3.3629e3 | 0.0032e3 | |||||
| 1 | x1 | -2.097 | 0.009 | |||||
| 2 | x2 | 10.82e3 | 0.24e3 | |||||
| 3 | x3 | 1.61117e3 | 0.00004e3 | 1.6E+03 | 1.62E+03 | |||
| 4 | x4 | 24.65e3 | 0.26e3 | 0 | ||||
| 5 | x5 | 1.63612e3 | 0.00018e3 | 1.62E+03 | 1.64E+03 | |||
| 6 | x6 | 63.70e3 | 0.33e3 | 0 | ||||
| 7 | x7 | 1.66660e3 | 0.00005e3 | 1.65E+03 | 1.68E+03 | |||
| 8 | x8 | 11.91e3 | 0.23e3 | 0 | ||||
| 9 | x9 | 1.7268e3 | 0.0004e3 | 1.7E+03 | 1.73E+03 | |||
| 10 | x10 | 10.26e3 | 0.22e3 | 0 | ||||
| 11 | x11 | 1.76271e3 | 0.00006e3 | 1.75E+03 | 1.77E+03 | |||
| 12 | x12 | 31.11e3 | 0.26e3 | 0 | ||||
| 13 | x13 | 1.777821e3 | 0.000032e3 | 1.77E+03 | 1.79E+03 | |||
| 14 | x14 | 0.20 | 0.15 | 0 |
| x0 | x1 | x2 | x3 | x4 | x5 | x6 | x7 | x8 | x9 | x10 | x11 | x12 | x13 | x14 | |
|---|---|---|---|---|---|---|---|---|---|---|---|---|---|---|---|
| x0 | 9.97 | 13.74e-3 (0.472) | -62 (-0.083) | -0.0040 (-0.028) | -71 (-0.085) | 0.016 (0.029) | -61 (-0.059) | 0.0047 (0.030) | -89 (-0.123) | 0.01 | -98 (-0.141) | -0.005 (-0.026) | -96 (-0.116) | -0.0030 (-0.029) | -0.015 (-0.031) |
| x1 | 13.74e-3 (0.472) | 8.49e-05 | 228.32e-3 (0.105) | -0 (-0.009) | 164.12e-3 (0.067) | 0.01e-3 (0.007) | 98.40e-3 (0.033) | 0 (0.006) | -26.43e-3 (-0.013) | 0.01e-3 (0.003) | -82.51e-3 (-0.041) | -0 (-0.005) | -110.76e-3 (-0.046) | -0 (-0.005) | -0.01e-3 (-0.006) |
| x2 | -62 (-0.083) | 228.32e-3 (0.105) | 5.56e+04 | -0.1919 (-0.018) | 0 (0.028) | -0.246 (-0.006) | 0 (0.016) | -0.0741 (-0.006) | 0 (0.019) | -0.22 (-0.003) | 0 (0.017) | 0.085 (0.006) | 0 (0.012) | 0.0483 (0.006) | 0.232 (0.007) |
| x3 | -0.0040 (-0.028) | -0 (-0.009) | -0.1919 (-0.018) | 0.00202 | 1.5220 (0.128) | -0.0079 (-0.991) | -2.1509 (-0.146) | -0.0022 (-0.991) | 0.3338 (0.033) | -0.0157 (-0.961) | 1.1268 (0.114) | 0.0027 (0.987) | 1.1707 (0.099) | 0.0014 (0.989) | 0.0067 (0.992) |
| x4 | -71 (-0.085) | 164.12e-3 (0.067) | 0 (0.028) | 1.5220 (0.128) | 6.99e+04 | -5.443 (-0.116) | -0 (-0.034) | -1.6980 (-0.130) | 0 (0.010) | -12.02 (-0.125) | 0 (0.041) | 2.049 (0.129) | 0 (0.011) | 1.1101 (0.130) | 5.216 (0.130) |
| x5 | 0.016 (0.029) | 0.01e-3 (0.007) | -0.246 (-0.006) | -0.0079 (-0.991) | -5.443 (-0.116) | 0.0317 | 8.552 (0.146) | 0.0088 (0.999) | -1.350 (-0.033) | 0.063 (0.969) | -4.490 (-0.115) | -0.011 (-0.995) | -4.693 (-0.100) | -0.0057 (-0.997) | -0.027 (-0.999) |
| x6 | -61 (-0.059) | 98.40e-3 (0.033) | 0 (0.016) | -2.1509 (-0.146) | -0 (-0.034) | 8.552 (0.146) | 1.08e+05 | 2.4137 (0.149) | -0 (-0.035) | 16.40 (0.137) | -0 (-0.018) | -2.882 (-0.146) | -0 (-0.020) | -1.5475 (-0.146) | -7.277 (-0.146) |
| x7 | 0.0047 (0.030) | 0 (0.006) | -0.0741 (-0.006) | -0.0022 (-0.991) | -1.6980 (-0.130) | 0.0088 (0.999) | 2.4137 (0.149) | 0.00243 | -0.3767 (-0.034) | 0.0174 (0.969) | -1.2490 (-0.115) | -0.0030 (-0.995) | -1.3003 (-0.100) | -0.0016 (-0.997) | -0.0075 (-1.000) |
| x8 | -89 (-0.123) | -26.43e-3 (-0.013) | 0 (0.019) | 0.3338 (0.033) | 0 (0.010) | -1.350 (-0.033) | -0 (-0.035) | -0.3767 (-0.034) | 5.17e+04 | 9.83 (0.119) | 0 (0.023) | 0.449 (0.033) | -0 (-0.003) | 0.2465 (0.034) | 1.156 (0.034) |
| x9 | 0.01 | 0.01e-3 (0.003) | -0.22 (-0.003) | -0.0157 (-0.961) | -12.02 (-0.125) | 0.063 (0.969) | 16.40 (0.137) | 0.0174 (0.969) | 9.83 (0.119) | 0.132 | -8.62 (-0.108) | -0.021 (-0.965) | -9.32 (-0.097) | -0.0113 (-0.967) | -0.053 (-0.970) |
| x10 | -98 (-0.141) | -82.51e-3 (-0.041) | 0 (0.017) | 1.1268 (0.114) | 0 (0.041) | -4.490 (-0.115) | -0 (-0.018) | -1.2490 (-0.115) | 0 (0.023) | -8.62 (-0.108) | 4.83e+04 | 1.205 (0.091) | 0 (0.007) | 0.8162 (0.115) | 3.838 (0.115) |
| x11 | -0.005 (-0.026) | -0 (-0.005) | 0.085 (0.006) | 0.0027 (0.987) | 2.049 (0.129) | -0.011 (-0.995) | -2.882 (-0.146) | -0.0030 (-0.995) | 0.449 (0.033) | -0.021 (-0.965) | 1.205 (0.091) | 0.00362 | 1.580 (0.100) | 0.0019 (0.993) | 0.009 (0.995) |
| x12 | -96 (-0.116) | -110.76e-3 (-0.046) | 0 (0.012) | 1.1707 (0.099) | 0 (0.011) | -4.693 (-0.100) | -0 (-0.020) | -1.3003 (-0.100) | -0 (-0.003) | -9.32 (-0.097) | 0 (0.007) | 1.580 (0.100) | 6.93e+04 | 0.7958 (0.094) | 3.995 (0.100) |
| x13 | -0.0030 (-0.029) | -0 (-0.005) | 0.0483 (0.006) | 0.0014 (0.989) | 1.1101 (0.130) | -0.0057 (-0.997) | -1.5475 (-0.146) | -0.0016 (-0.997) | 0.2465 (0.034) | -0.0113 (-0.967) | 0.8162 (0.115) | 0.0019 (0.993) | 0.7958 (0.094) | 0.00104 | 0.0049 (0.998) |
| x14 | -0.015 (-0.031) | -0.01e-3 (-0.006) | 0.232 (0.007) | 0.0067 (0.992) | 5.216 (0.130) | -0.027 (-0.999) | -7.277 (-0.146) | -0.0075 (-1.000) | 1.156 (0.034) | -0.053 (-0.970) | 3.838 (0.115) | 0.009 (0.995) | 3.995 (0.100) | 0.0049 (0.998) | 0.0229 |
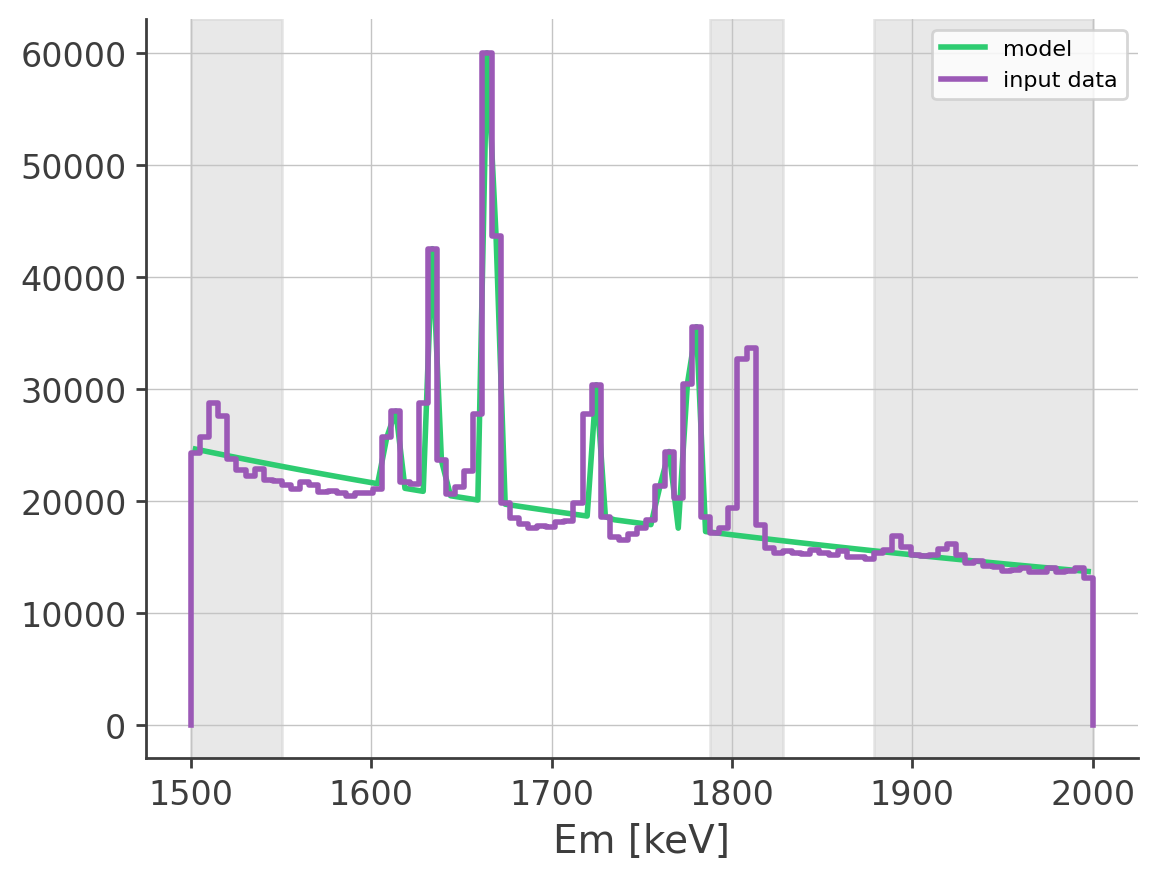
[20]:
ax, _ = instance.plot_energy_spectrum()
Mask more
[21]:
instance.set_mask((1500.0, 1550.0) * u.keV, (1790.0, 1825.0) * u.keV, (1880.0, 2000.0) * u.keV)
instance.mask
[21]:
array([ True,  True,  True,  True,  True,  True,  True,  True,  True,
        True, False, False, False, False, False, False, False, False,
       False, False, False, False, False, False, False, False, False,
       False, False, False, False, False, False, False, False, False,
       False, False, False, False, False, False, False, False, False,
       False, False, False, False, False, False, False, False, False,
       False, False, False,  True,  True,  True,  True,  True,  True,
        True,  True, False, False, False, False, False, False, False,
       False, False, False,  True,  True,  True,  True,  True,  True,
        True,  True,  True,  True,  True,  True,  True,  True,  True,
        True,  True,  True,  True,  True,  True,  True,  True,  True])
[22]:
m = instance.fit_energy_spectrum(param_limits = param_limits)
m
[22]:
| Migrad | |
|---|---|
| FCN = -1.13e+07 | Nfcn = 1912 |
| EDM = 5.63e-06 (Goal: 0.0001) | |
| Valid Minimum | Below EDM threshold (goal x 10) |
| No parameters at limit | Below call limit |
| Hesse ok | Covariance FORCED pos. def. |
| Name | Value | Hesse Error | Minos Error- | Minos Error+ | Limit- | Limit+ | Fixed | |
|---|---|---|---|---|---|---|---|---|
| 0 | x0 | 3.360e3 | 0.005e3 | |||||
| 1 | x1 | -2.060 | 0.018 | |||||
| 2 | x2 | 11.03e3 | 0.24e3 | |||||
| 3 | x3 | 1.611170e3 | 0.000013e3 | 1.6E+03 | 1.62E+03 | |||
| 4 | x4 | 24.82e3 | 0.26e3 | 0 | ||||
| 5 | x5 | 1.63612e3 | 0.00005e3 | 1.62E+03 | 1.64E+03 | |||
| 6 | x6 | 63.84e3 | 0.33e3 | 0 | ||||
| 7 | x7 | 1.666600e3 | 0.000014e3 | 1.65E+03 | 1.68E+03 | |||
| 8 | x8 | 12.00e3 | 0.23e3 | 0 | ||||
| 9 | x9 | 1.72682e3 | 0.00012e3 | 1.7E+03 | 1.73E+03 | |||
| 10 | x10 | 10.32e3 | 0.22e3 | 0 | ||||
| 11 | x11 | 1.762707e3 | 0.000017e3 | 1.75E+03 | 1.77E+03 | |||
| 12 | x12 | 31.16e3 | 0.26e3 | 0 | ||||
| 13 | x13 | 1.777821e3 | 0.000009e3 | 1.77E+03 | 1.79E+03 | |||
| 14 | x14 | 0.21 | 0.04 | 0 |
| x0 | x1 | x2 | x3 | x4 | x5 | x6 | x7 | x8 | x9 | x10 | x11 | x12 | x13 | x14 | |
|---|---|---|---|---|---|---|---|---|---|---|---|---|---|---|---|
| x0 | 28.9 | 73.91e-3 (0.742) | -18 (-0.014) | 1.43e-3 (0.020) | -55 (-0.039) | -0.0069 (-0.026) | -115 (-0.066) | -1.79e-3 (-0.024) | -213 (-0.175) | -0.064 (-0.100) | -254 (-0.215) | 3.97e-3 (0.042) | -267 (-0.189) | 1.42e-3 (0.029) | 0.0051 (0.022) |
| x1 | 73.91e-3 (0.742) | 0.000343 | 680.77e-3 (0.154) | -0 (-0.003) | 452.50e-3 (0.093) | -0.01e-3 (-0.009) | 155.92e-3 (0.026) | -0 (-0.016) | -304.80e-3 (-0.073) | -0.11e-3 (-0.049) | -529.61e-3 (-0.131) | 0.01e-3 (0.027) | -627.95e-3 (-0.130) | 0 (0.020) | 0.01e-3 (0.016) |
| x2 | -18 (-0.014) | 680.77e-3 (0.154) | 5.7e+04 | -257.83e-3 (-0.081) | 0 (0.045) | 0.0463 (0.004) | 0 (0.028) | 3.17e-3 (0.001) | 0 (0.023) | 0.301 (0.011) | 0 (0.014) | -8.08e-3 (-0.002) | 0 (0.007) | -1.55e-3 | -0.0029 (-0.000) |
| x3 | 1.43e-3 (0.020) | -0 (-0.003) | -257.83e-3 (-0.081) | 0.000178 | 94.41e-3 (0.027) | -0.59e-3 (-0.898) | -115.65e-3 (-0.027) | -0.16e-3 (-0.899) | -115.18e-3 (-0.038) | -1.17e-3 (-0.741) | -75.51e-3 (-0.026) | 0.20e-3 (0.851) | -148.66e-3 (-0.043) | 0.11e-3 (0.878) | 0.51e-3 (0.903) |
| x4 | -55 (-0.039) | 452.50e-3 (0.093) | 0 (0.045) | 94.41e-3 (0.027) | 6.9e+04 | 0.2222 (0.017) | -0 (-0.007) | -124.70e-3 (-0.035) | 0 (0.022) | -0.567 (-0.018) | 0 (0.016) | 141.03e-3 (0.031) | -0 (-0.014) | 81.75e-3 (0.034) | 0.3865 (0.035) |
| x5 | -0.0069 (-0.026) | -0.01e-3 (-0.009) | 0.0463 (0.004) | -0.59e-3 (-0.898) | 0.2222 (0.017) | 0.00241 | 0.4265 (0.027) | 0.66e-3 (0.989) | 0.4628 (0.042) | 0.0047 (0.814) | 0.3103 (0.029) | -0.81e-3 (-0.936) | 0.5954 (0.046) | -0.43e-3 (-0.965) | -0.0021 (-0.993) |
| x6 | -115 (-0.066) | 155.92e-3 (0.026) | 0 (0.028) | -115.65e-3 (-0.027) | -0 (-0.007) | 0.4265 (0.027) | 1.06e+05 | 161.42e-3 (0.036) | 0 (0.022) | 1.196 (0.031) | 0 (0.019) | -149.49e-3 (-0.026) | 0 (0.016) | -77.96e-3 (-0.026) | -0.3599 (-0.026) |
| x7 | -1.79e-3 (-0.024) | -0 (-0.016) | 3.17e-3 (0.001) | -0.16e-3 (-0.899) | -124.70e-3 (-0.035) | 0.66e-3 (0.989) | 161.42e-3 (0.036) | 0.000187 | 124.96e-3 (0.040) | 1.32e-3 (0.815) | 83.69e-3 (0.028) | -0.23e-3 (-0.937) | 168.57e-3 (0.047) | -0.12e-3 (-0.967) | -0.57e-3 (-0.995) |
| x8 | -213 (-0.175) | -304.80e-3 (-0.073) | 0 (0.023) | -115.18e-3 (-0.038) | 0 (0.022) | 0.4628 (0.042) | 0 (0.022) | 124.96e-3 (0.040) | 5.13e+04 | 10.343 (0.387) | 0 (0.059) | -172.13e-3 (-0.043) | 0 (0.036) | -83.28e-3 (-0.040) | -0.3790 (-0.040) |
| x9 | -0.064 (-0.100) | -0.11e-3 (-0.049) | 0.301 (0.011) | -1.17e-3 (-0.741) | -0.567 (-0.018) | 0.0047 (0.814) | 1.196 (0.031) | 1.32e-3 (0.815) | 10.343 (0.387) | 0.0139 | 1.233 (0.048) | -1.60e-3 (-0.774) | 1.677 (0.054) | -0.86e-3 (-0.796) | -0.0041 (-0.819) |
| x10 | -254 (-0.215) | -529.61e-3 (-0.131) | 0 (0.014) | -75.51e-3 (-0.026) | 0 (0.016) | 0.3103 (0.029) | 0 (0.019) | 83.69e-3 (0.028) | 0 (0.059) | 1.233 (0.048) | 4.8e+04 | -409.89e-3 (-0.107) | 0 (0.042) | -56.58e-3 (-0.028) | -0.2522 (-0.027) |
| x11 | 3.97e-3 (0.042) | 0.01e-3 (0.027) | -8.08e-3 (-0.002) | 0.20e-3 (0.851) | 141.03e-3 (0.031) | -0.81e-3 (-0.936) | -149.49e-3 (-0.026) | -0.23e-3 (-0.937) | -172.13e-3 (-0.043) | -1.60e-3 (-0.774) | -409.89e-3 (-0.107) | 0.000308 | -218.46e-3 (-0.048) | 0.15e-3 (0.915) | 0.69e-3 (0.942) |
| x12 | -267 (-0.189) | -627.95e-3 (-0.130) | 0 (0.007) | -148.66e-3 (-0.043) | -0 (-0.014) | 0.5954 (0.046) | 0 (0.016) | 168.57e-3 (0.047) | 0 (0.036) | 1.677 (0.054) | 0 (0.042) | -218.46e-3 (-0.048) | 6.85e+04 | -162.25e-3 (-0.068) | -0.5139 (-0.047) |
| x13 | 1.42e-3 (0.029) | 0 (0.020) | -1.55e-3 | 0.11e-3 (0.878) | 81.75e-3 (0.034) | -0.43e-3 (-0.965) | -77.96e-3 (-0.026) | -0.12e-3 (-0.967) | -83.28e-3 (-0.040) | -0.86e-3 (-0.796) | -56.58e-3 (-0.028) | 0.15e-3 (0.915) | -162.25e-3 (-0.068) | 8.42e-05 | 0.37e-3 (0.972) |
| x14 | 0.0051 (0.022) | 0.01e-3 (0.016) | -0.0029 (-0.000) | 0.51e-3 (0.903) | 0.3865 (0.035) | -0.0021 (-0.993) | -0.3599 (-0.026) | -0.57e-3 (-0.995) | -0.3790 (-0.040) | -0.0041 (-0.819) | -0.2522 (-0.027) | 0.69e-3 (0.942) | -0.5139 (-0.047) | 0.37e-3 (0.972) | 0.00177 |
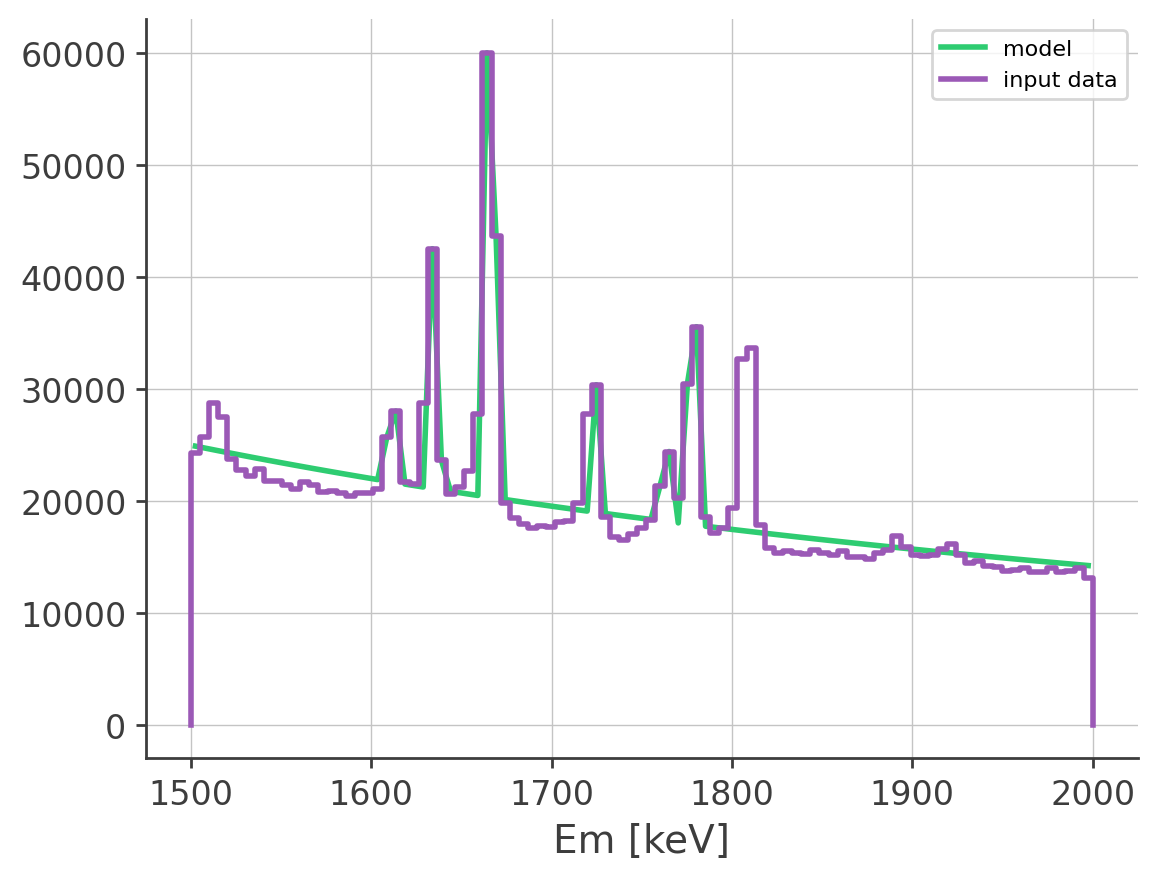
[23]:
ax, _ = instance.plot_energy_spectrum()
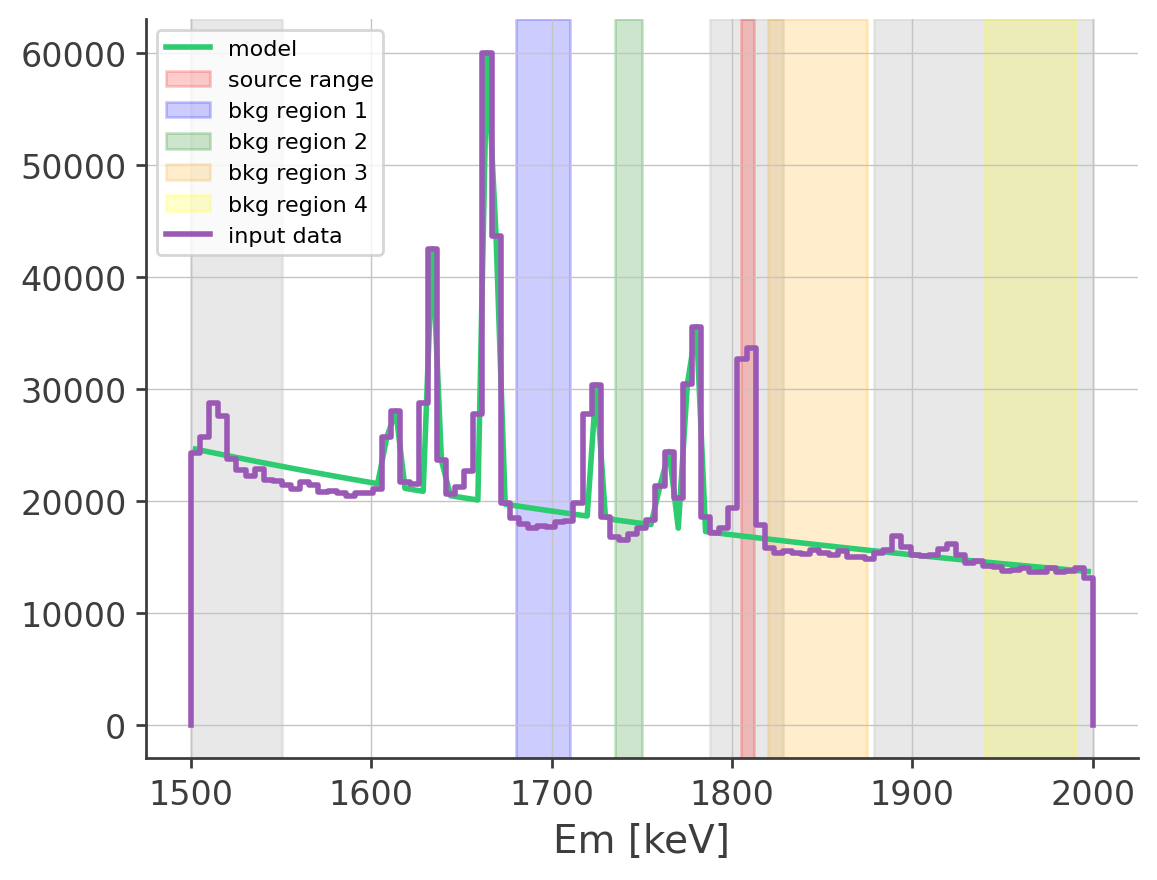
3. Generate Background Histogram
[24]:
source_range = (1805, 1812)  * u.keV #counts estimation in Al26 line

background_region_1 = (1680, 1710) * u.keV #background counts estimation before the line
background_region_2 = (1735, 1750) * u.keV #background counts estimation before the line
background_region_3 = (1820, 1875) * u.keV #background counts estimation before the line
background_region_4 = (1940, 1990) * u.keV #background counts estimation before the line
[25]:
bkg_model_histogram = instance.generate_bkg_model_histogram(
source_range, [background_region_1, background_region_2, background_region_3, background_region_4])
bkg_model_histogram_smoothing = instance.generate_bkg_model_histogram(
source_range, [background_region_1, background_region_2, background_region_3, background_region_4],
smoothing_fwhm=20 * u.deg)
bkg_model_histogram_l_cut = instance.generate_bkg_model_histogram(
source_range, [background_region_1, background_region_2, background_region_3, background_region_4],
l_cut=4)
bkg_model_histogram_rebin_smoothing = instance.generate_bkg_model_histogram(
source_range, [background_region_1, background_region_2, background_region_3, background_region_4],
smoothing_fwhm=20 * u.deg, rebin_phi=10)
bkg_model_histogram_rebin_l_cut = instance.generate_bkg_model_histogram(
source_range, [background_region_1, background_region_2, background_region_3, background_region_4],
l_cut=4, rebin_phi=10)
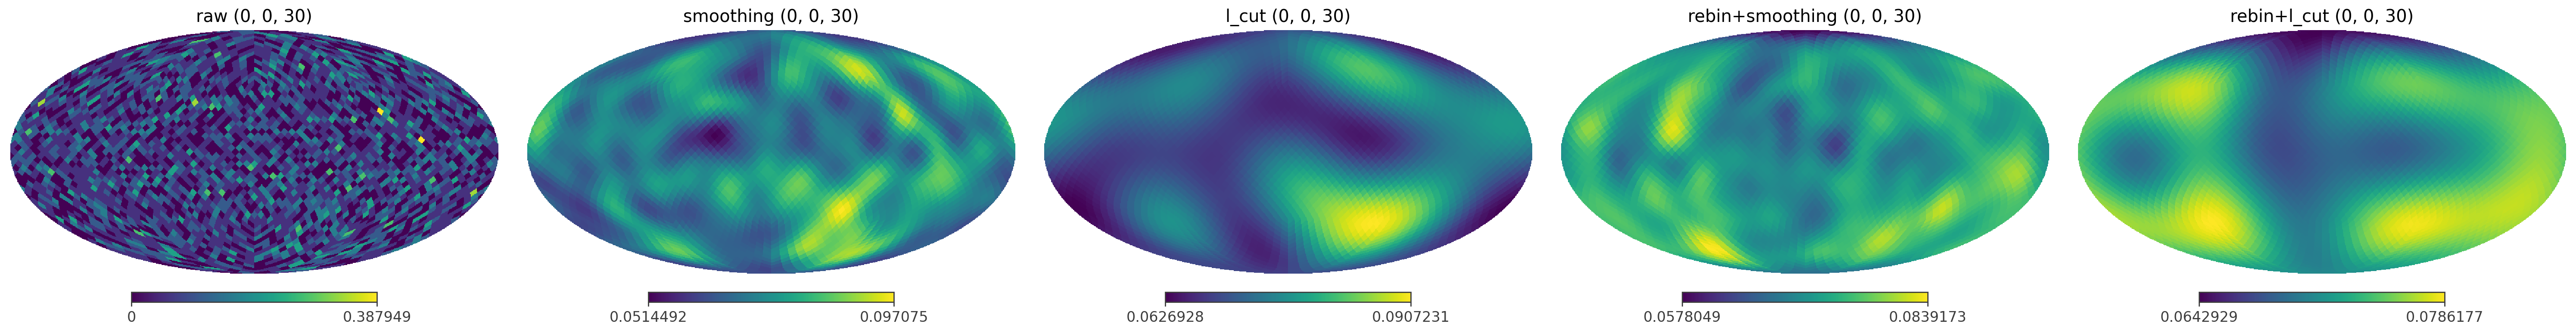
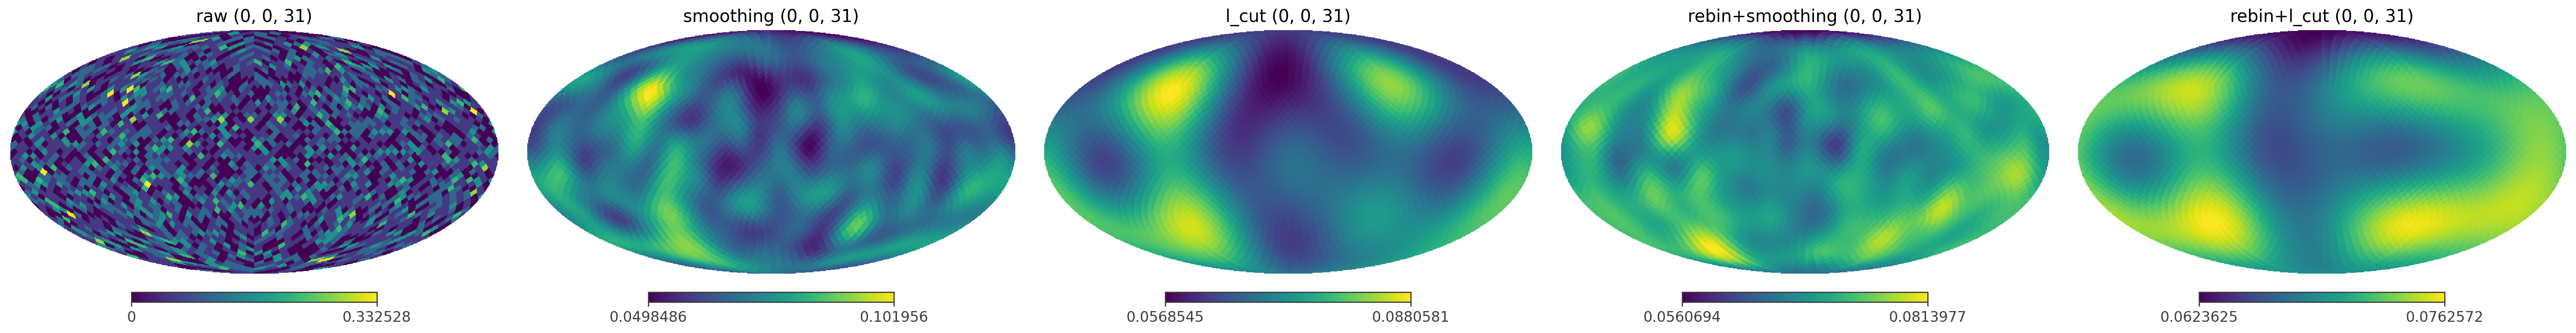
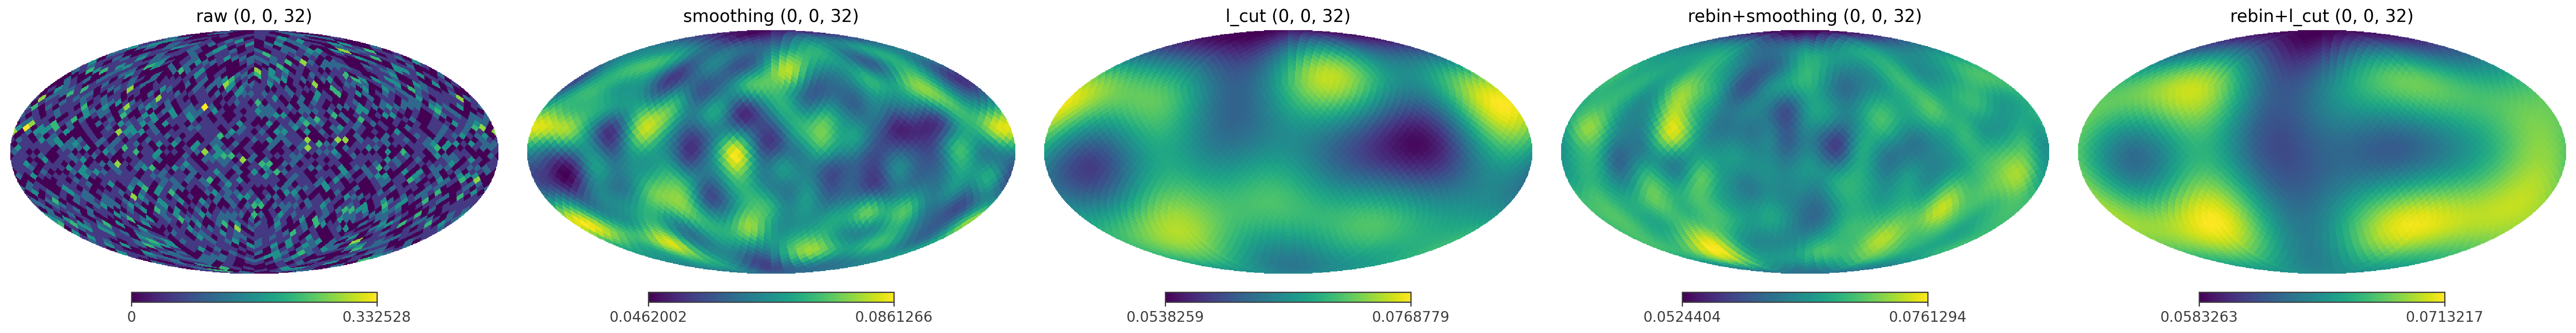
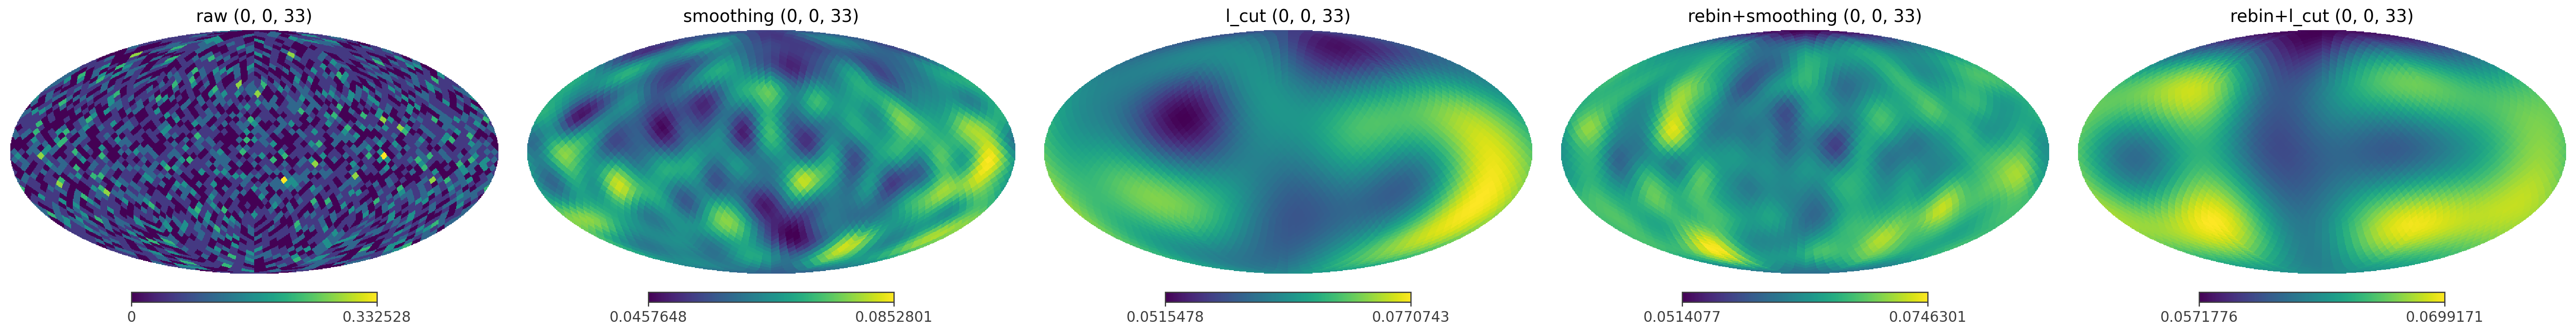
# collect all models for comparison
models = {
'raw': bkg_model_histogram,
'smoothing': bkg_model_histogram_smoothing,
'l_cut': bkg_model_histogram_l_cut,
'rebin+smoothing': bkg_model_histogram_rebin_smoothing,
'rebin+l_cut': bkg_model_histogram_rebin_l_cut,
}
The energy range [1680. 1710.] is modified to [1681.81818182, 1707.07070707]
The energy range [1735. 1750.] is modified to [1737.37373737, 1747.47474747]
The energy range [1820. 1875.] is modified to [1823.23232323, 1873.73737374]
The energy range [1940. 1990.] is modified to [1944.44444444, 1989.8989899]
Applying low-pass filter with l_cut=4: retaining features on angular scales larger than ~45.0 degrees.
The energy range [1680. 1710.] is modified to [1681.81818182, 1707.07070707]
The energy range [1735. 1750.] is modified to [1737.37373737, 1747.47474747]
The energy range [1820. 1875.] is modified to [1823.23232323, 1873.73737374]
The energy range [1940. 1990.] is modified to [1944.44444444, 1989.8989899]
Applying low-pass filter with l_cut=4: retaining features on angular scales larger than ~45.0 degrees.
[26]:
ax, _ = instance.plot_energy_spectrum()
ax.axvspan(source_range[0].value,        source_range[1].value,        color='red',    alpha=0.2, label='source range')
ax.axvspan(background_region_1[0].value, background_region_1[1].value, color='blue',   alpha=0.2, label='bkg region 1')
ax.axvspan(background_region_2[0].value, background_region_2[1].value, color='green',  alpha=0.2, label='bkg region 2')
ax.axvspan(background_region_3[0].value, background_region_3[1].value, color='orange', alpha=0.2, label='bkg region 3')
ax.axvspan(background_region_4[0].value, background_region_4[1].value, color='yellow', alpha=0.2, label='bkg region 4')
ax.legend()
[26]:
<matplotlib.legend.Legend at 0x31fb46b90>
[27]:
bkg_model_histogram.write('bkg_model_al26_line.hdf5', overwrite=True)
bkg_model_histogram_smoothing.write('bkg_model_al26_line_smoothing.hdf5', overwrite=True)
bkg_model_histogram_l_cut.write('bkg_model_al26_line_l_cut.hdf5', overwrite=True)
bkg_model_histogram_rebin_smoothing.write('bkg_model_al26_line_rebin_smoothing.hdf5', overwrite=True)
bkg_model_histogram_rebin_l_cut.write('bkg_model_al26_line_rebin_l_cut.hdf5', overwrite=True)
4. Compare the background model with the actual background data
[28]:
%%time

bkg_histogram_in_Al26line = BinnedData("inputs_check_results.yaml")
bkg_histogram_in_Al26line.get_binned_data(
    unbinned_data=path_to_bkg, make_binning_plots=False,
    output_name='bkg_data_al26_line_for_comparison', show_plots=False)
binning data...
fill() discarded one or more values due to out-of-bounds coordinate in a dimension without under/overflow tracking
Time unit: s
Em unit: keV
Phi unit: deg
PsiChi unit: None
CPU times: user 24.6 s, sys: 2.35 s, total: 27 s
Wall time: 26.7 s
[29]:
bkg_histogram_in_Al26line = Histogram.open('bkg_data_al26_line_for_comparison.hdf5').todense()
Normalization
[30]:
count_obs = np.sum(bkg_histogram_in_Al26line[:])
print(f'data: {count_obs:.1f}')
for name, model in models.items():
    count_model = np.sum(model[:])
    diff = (count_obs / count_model - 1) * 1e2
    print(f'{name:20s}: {count_model:.1f}  diff = {diff:+.2f}%')
data: 26126.0
raw                 : 22169.5  diff = +17.85%
smoothing           : 22168.1  diff = +17.85%
l_cut               : 22153.6  diff = +17.93%
rebin+smoothing     : 22169.5  diff = +17.85%
rebin+l_cut         : 22169.5  diff = +17.85%
[31]:
spectrum_bkg.project('Em').draw()
plt.ylim(1e4, 1e5)
plt.yscale('log')
plt.grid()
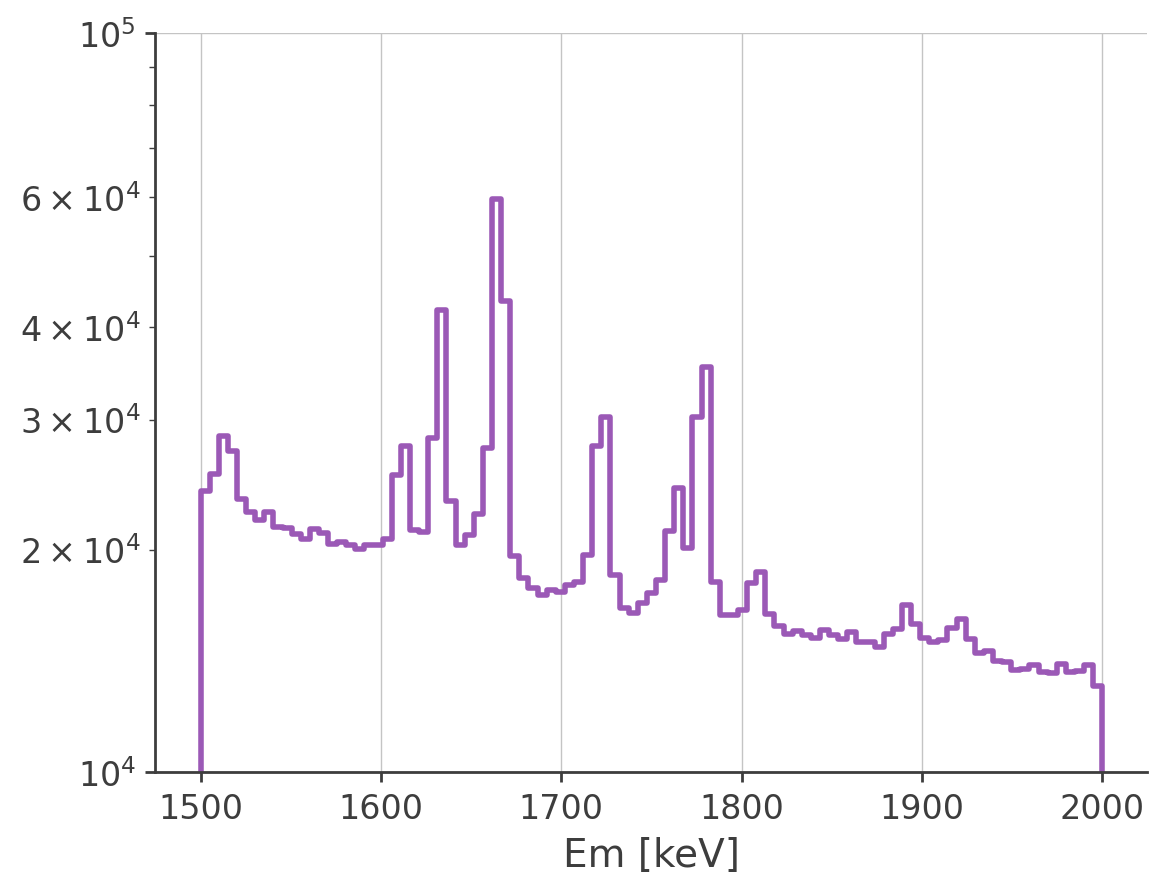
The underestimation is caused by the fact that the background also has a line around 1.809 keV
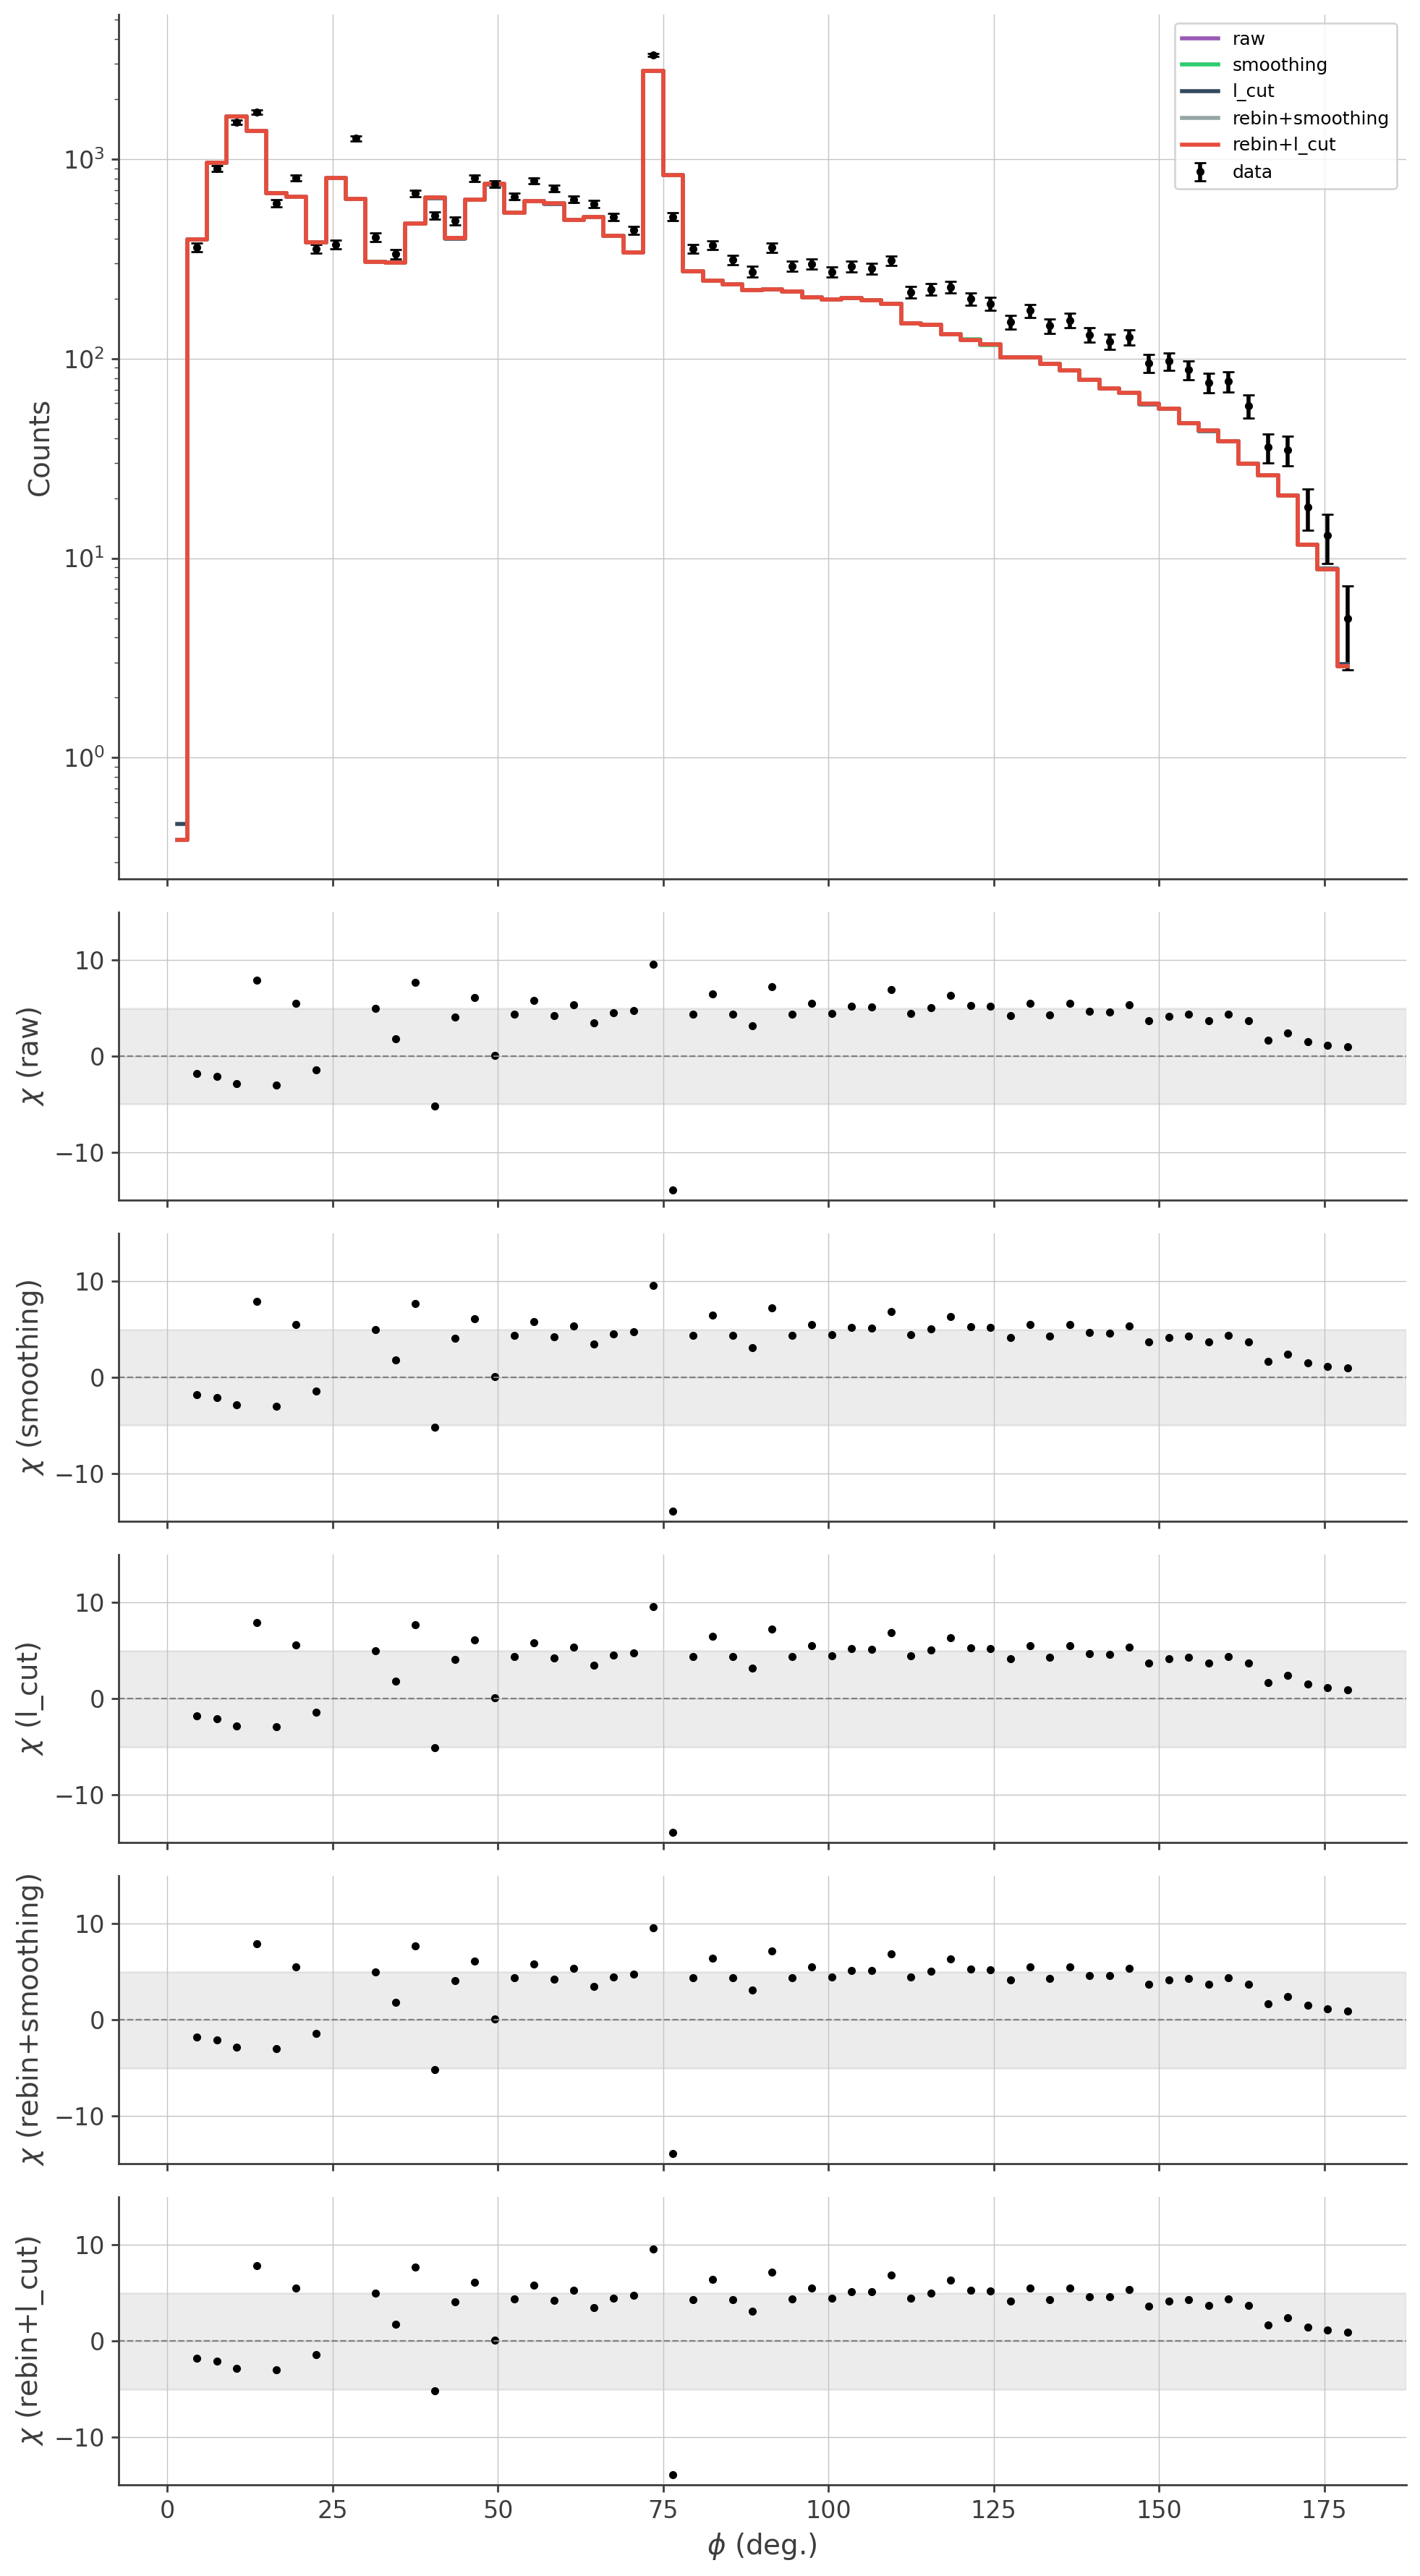
Phi distribution
[32]:
phi_obs = bkg_histogram_in_Al26line.project('Phi').todense()
phi_centers = phi_obs.axis.centers
phi_edges   = phi_obs.axis.edges
width = np.diff(phi_edges)[0]

fig, axes = plt.subplots(len(models) + 1, 1,
                         figsize=(10, 3 * (len(models) + 1)), sharex=True,
                         gridspec_kw={'height_ratios': [3] + [1] * len(models)})

axes[0].errorbar(phi_centers, phi_obs.contents, yerr=np.sqrt(phi_obs.contents),
                 fmt='.', color='black', label='data', capsize=3)
for name, model in models.items():
    phi_model = model.project('Phi').todense()
    axes[0].step(phi_centers, phi_model.contents, where='mid', label=name)
axes[0].set_ylabel('Counts')
axes[0].set_yscale('log')
axes[0].legend(fontsize=9)
axes[0].grid()

for ax, (name, model) in zip(axes[1:], models.items()):
    phi_model = model.project('Phi').todense()
    chi = (phi_obs.contents - phi_model.contents) / np.sqrt(phi_obs.contents)
    ax.plot(phi_centers, chi, '.', color='black')
    ax.axhline(0, color='grey', linestyle='--', linewidth=0.8)
    ax.axhspan(-5, 5, color='grey', alpha=0.15)
    ax.set_ylabel(fr'$\chi$ ({name})')
    ax.set_ylim(-15, 15)
    ax.grid()

axes[-1].set_xlabel(r'$\phi$ (deg.)')
plt.tight_layout()
plt.show()
WARNING RuntimeWarning: divide by zero encountered in divide


WARNING RuntimeWarning: divide by zero encountered in divide


WARNING RuntimeWarning: divide by zero encountered in divide


WARNING RuntimeWarning: divide by zero encountered in divide


WARNING RuntimeWarning: divide by zero encountered in divide
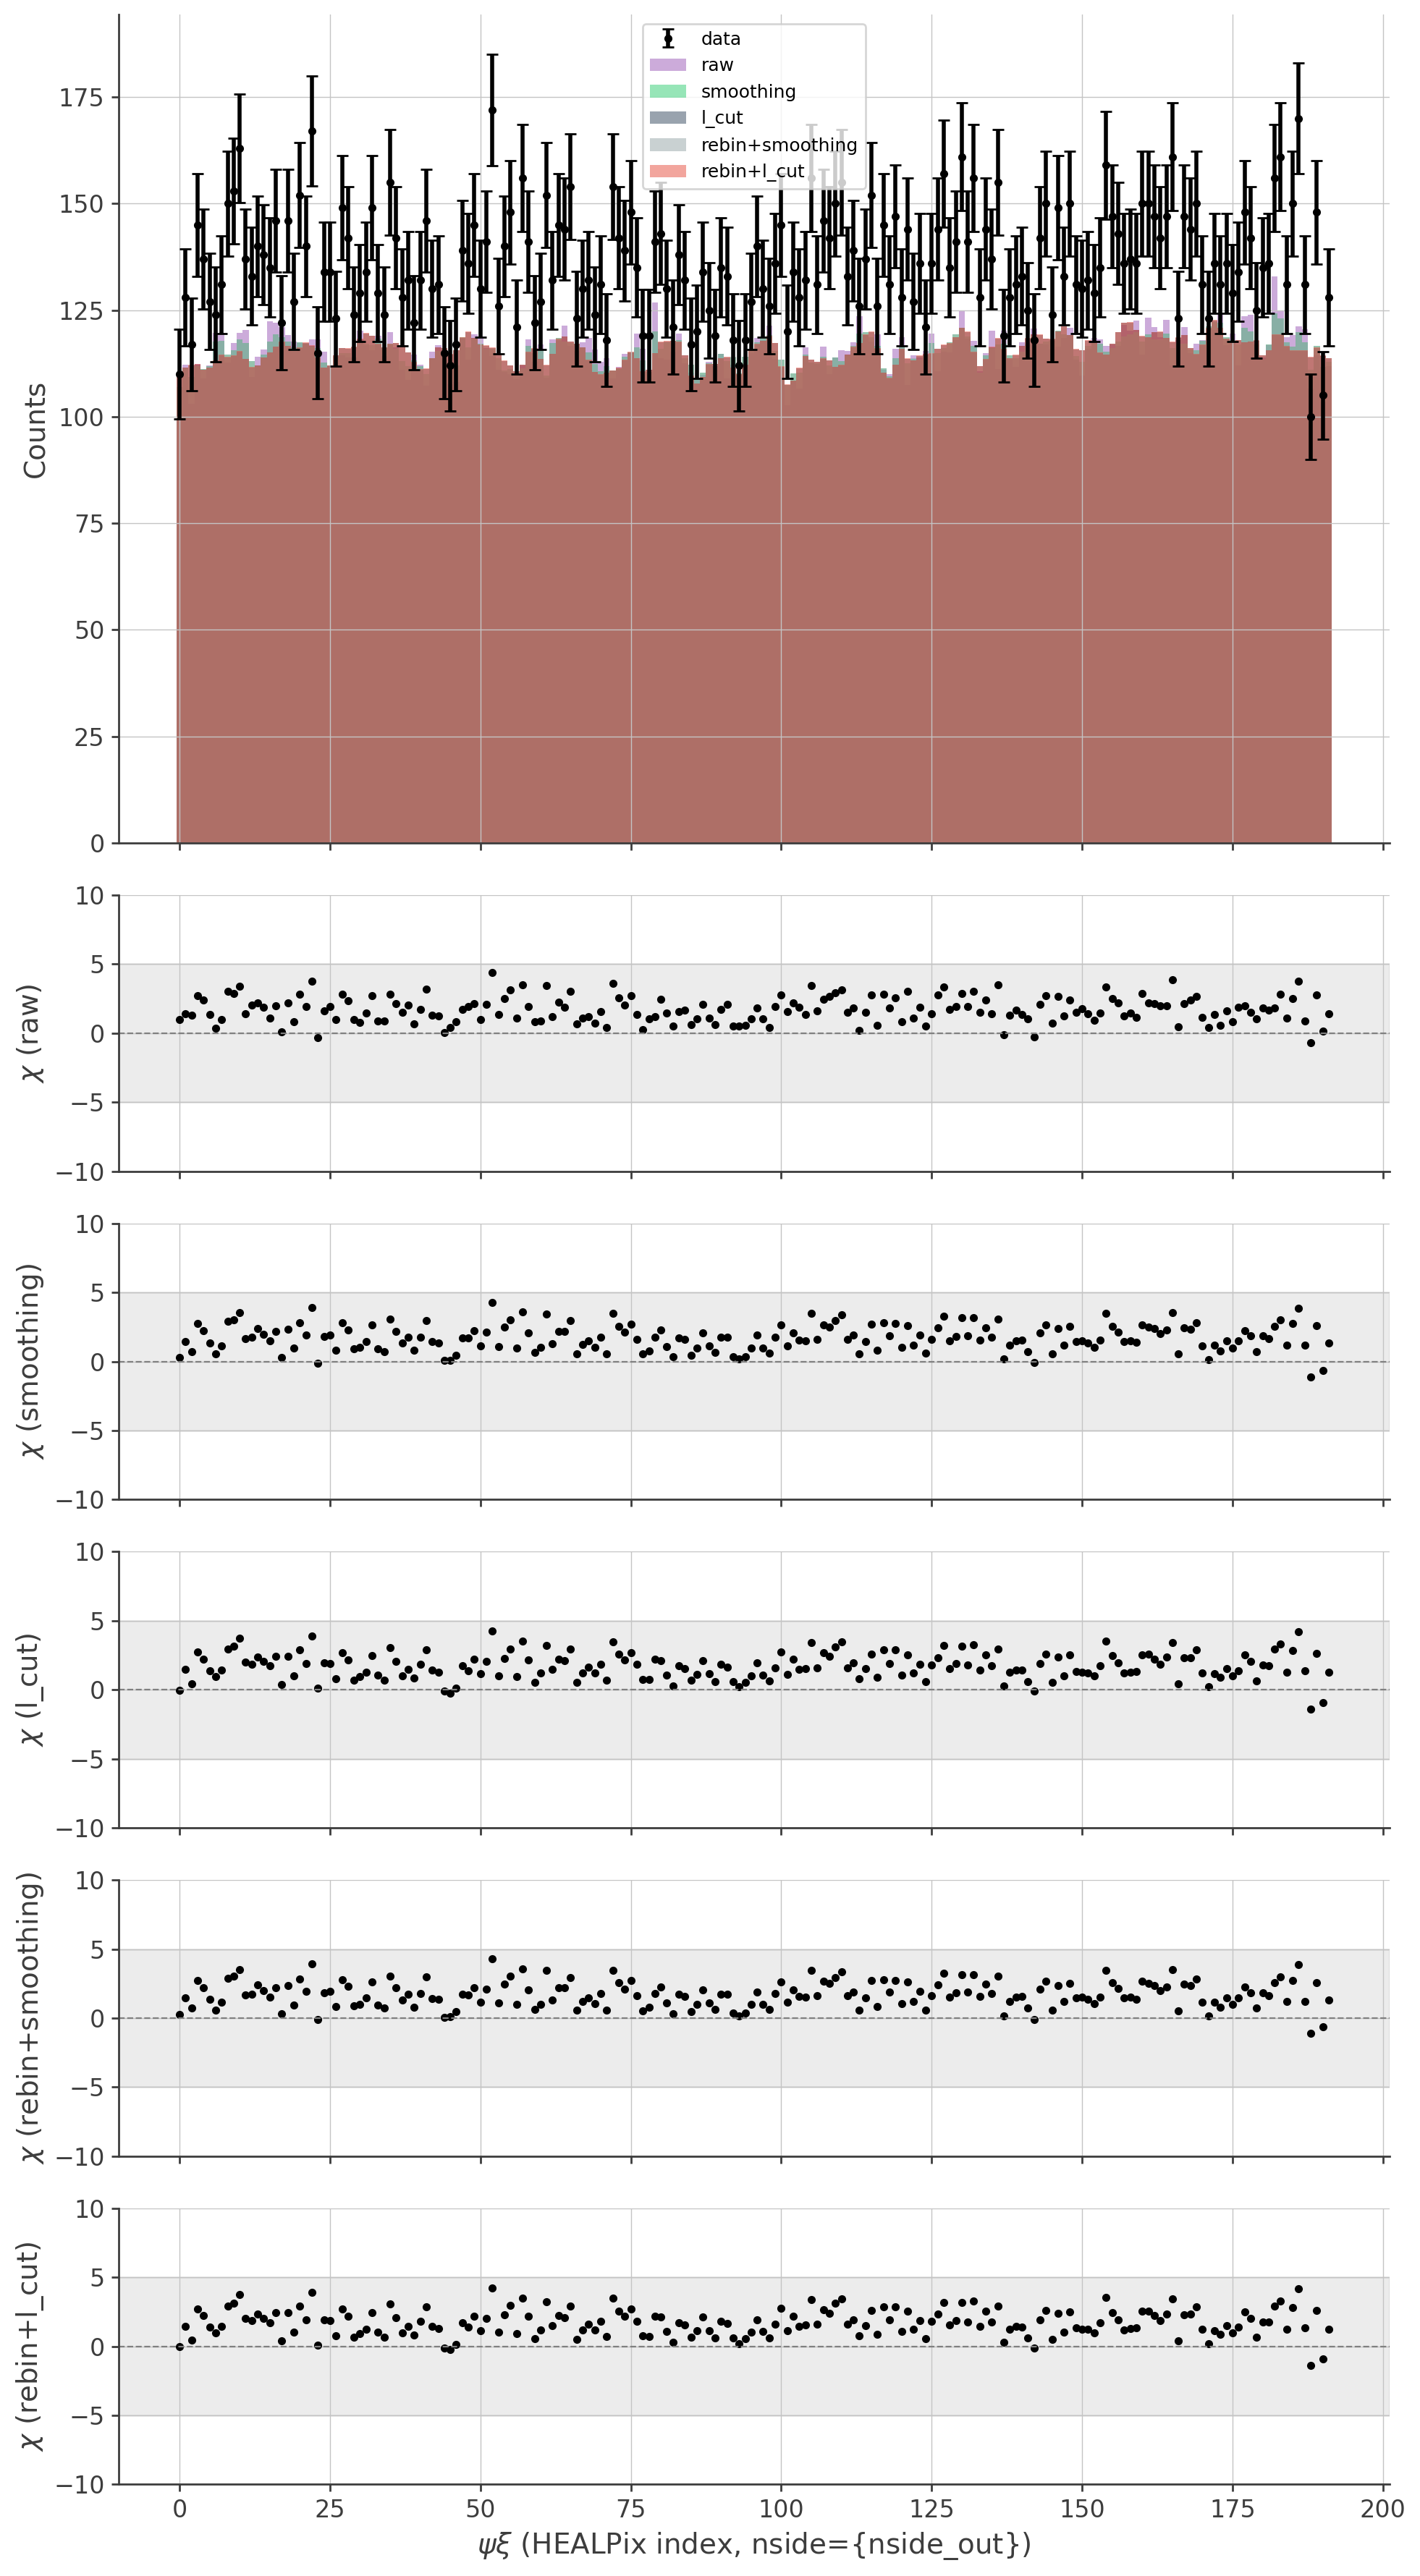
PsiChi distribution
[33]:
nside_out = 4
psichi_obs = bkg_histogram_in_Al26line.project('PsiChi').todense()
psichi_obs_rebinned = hp.ud_grade(psichi_obs[:], nside_out, power=-2)
x = np.arange(hp.nside2npix(nside_out))

fig, axes = plt.subplots(len(models) + 1, 1,
                         figsize=(10, 3 * (len(models) + 1)), sharex=True,
                         gridspec_kw={'height_ratios': [3] + [1] * len(models)})

axes[0].errorbar(x, psichi_obs_rebinned, yerr=np.sqrt(psichi_obs_rebinned),
                 fmt='.', color='black', label='data', capsize=3)
for name, model in models.items():
    psichi_model = model.project('PsiChi').todense()
    psichi_model_rebinned = hp.ud_grade(psichi_model[:], nside_out, power=-2)
    axes[0].bar(x, psichi_model_rebinned, width=1, alpha=0.5, label=name)
axes[0].set_ylabel('Counts')
axes[0].legend(fontsize=9)
axes[0].grid()

for ax, (name, model) in zip(axes[1:], models.items()):
    psichi_model = model.project('PsiChi').todense()
    psichi_model_rebinned = hp.ud_grade(psichi_model[:], nside_out, power=-2)
    chi = (psichi_obs_rebinned - psichi_model_rebinned) / np.sqrt(psichi_obs_rebinned)
    ax.plot(x, chi, '.', color='black')
    ax.axhline(0, color='grey', linestyle='--', linewidth=0.8)
    ax.axhspan(-5, 5, color='grey', alpha=0.15)
    ax.set_ylabel(fr'$\chi$ ({name})')
    ax.set_ylim(-10, 10)
    ax.grid()

axes[-1].set_xlabel(r'$\psi\xi$ (HEALPix index, nside={nside_out})')
plt.tight_layout()
plt.show()
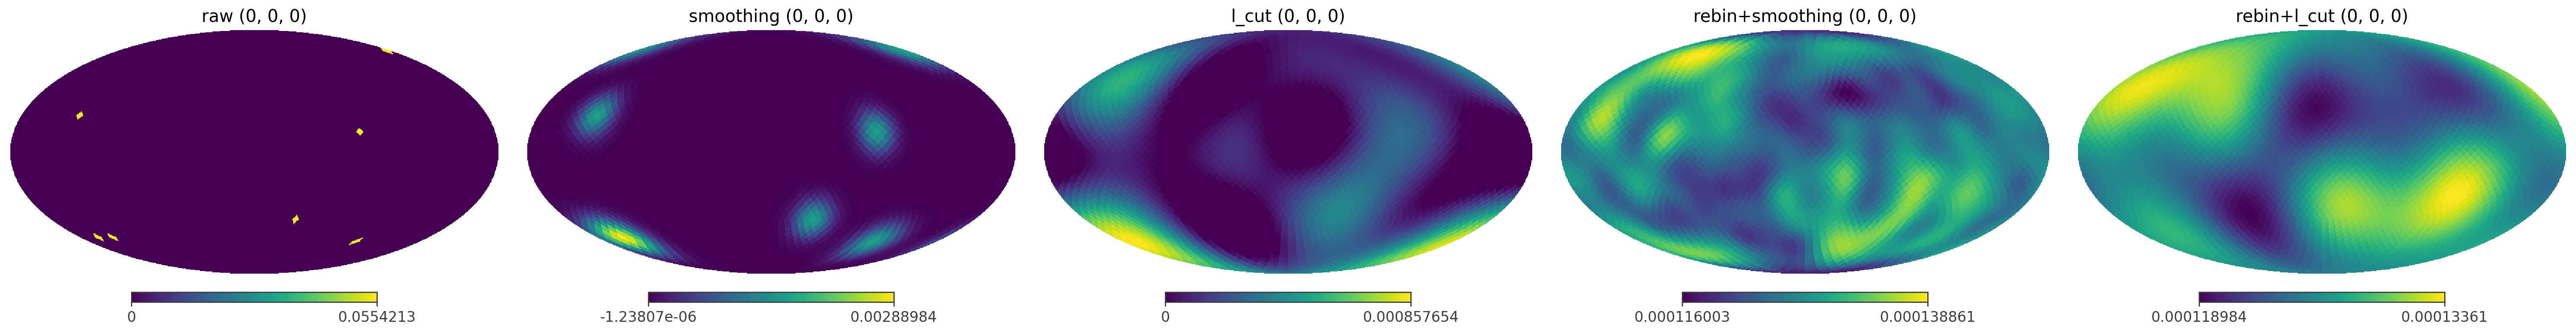
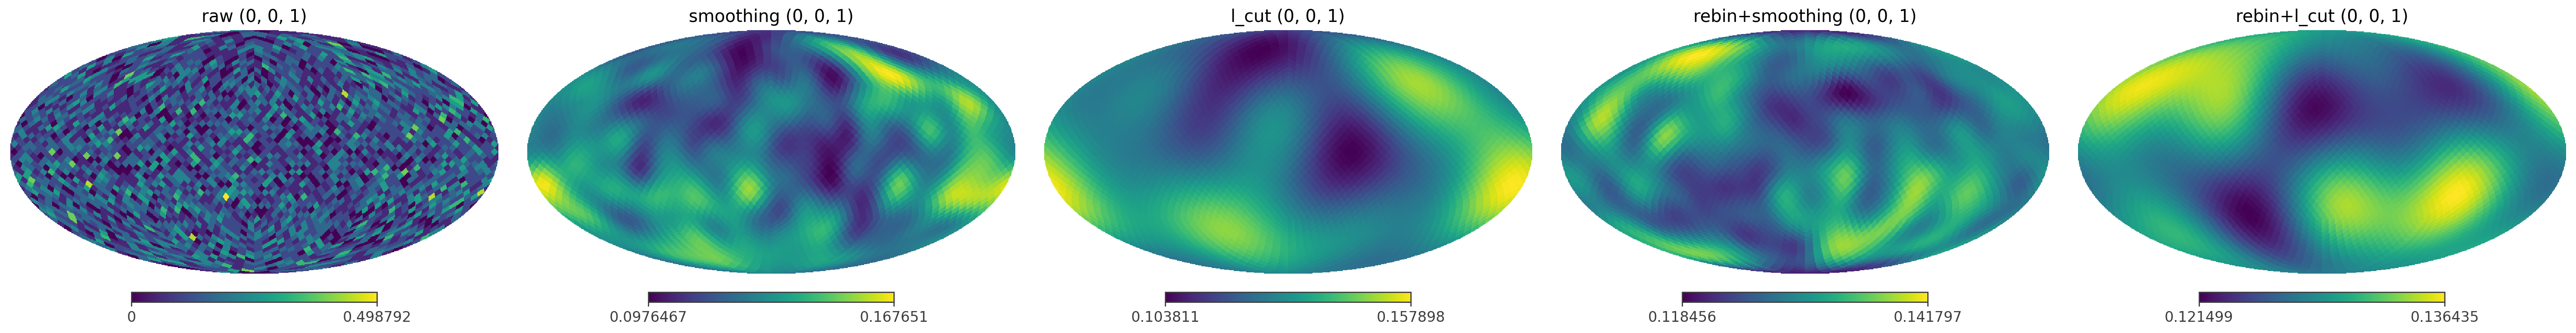
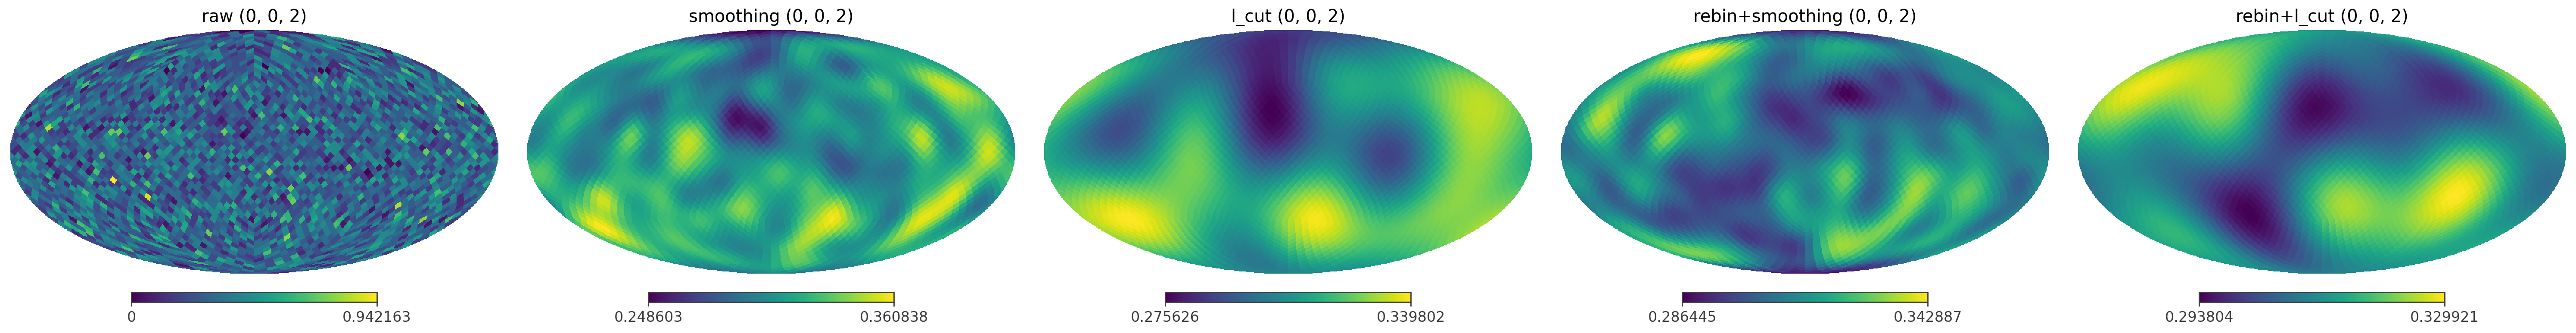
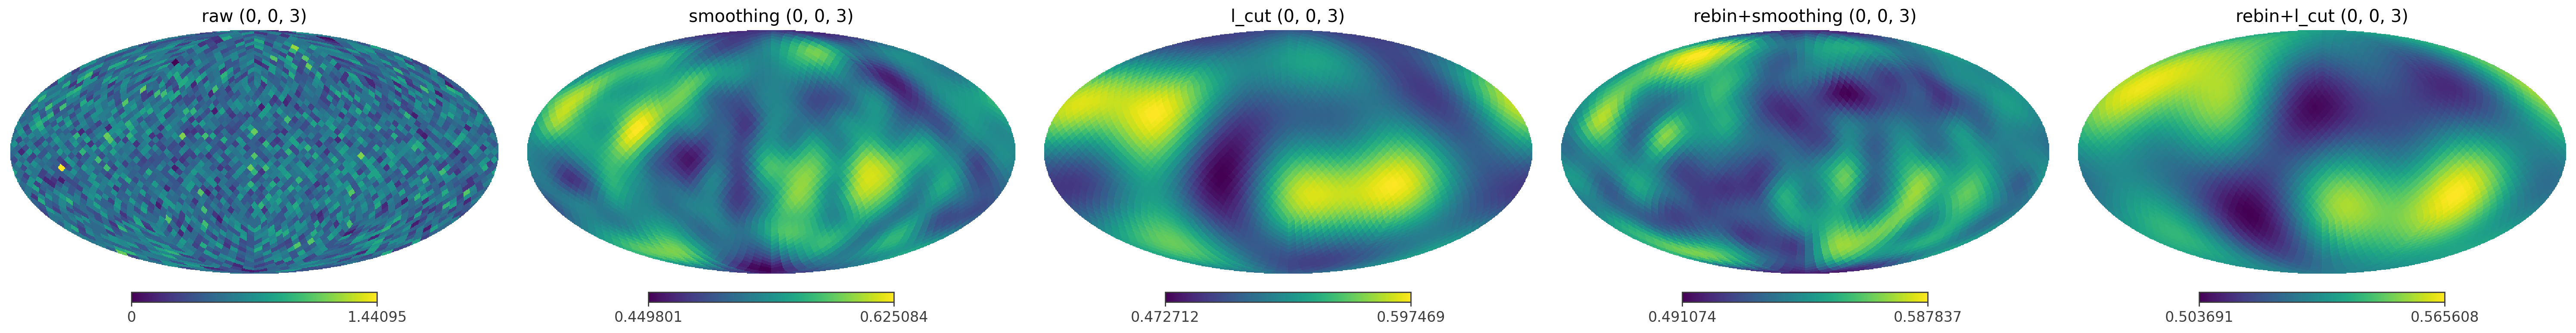
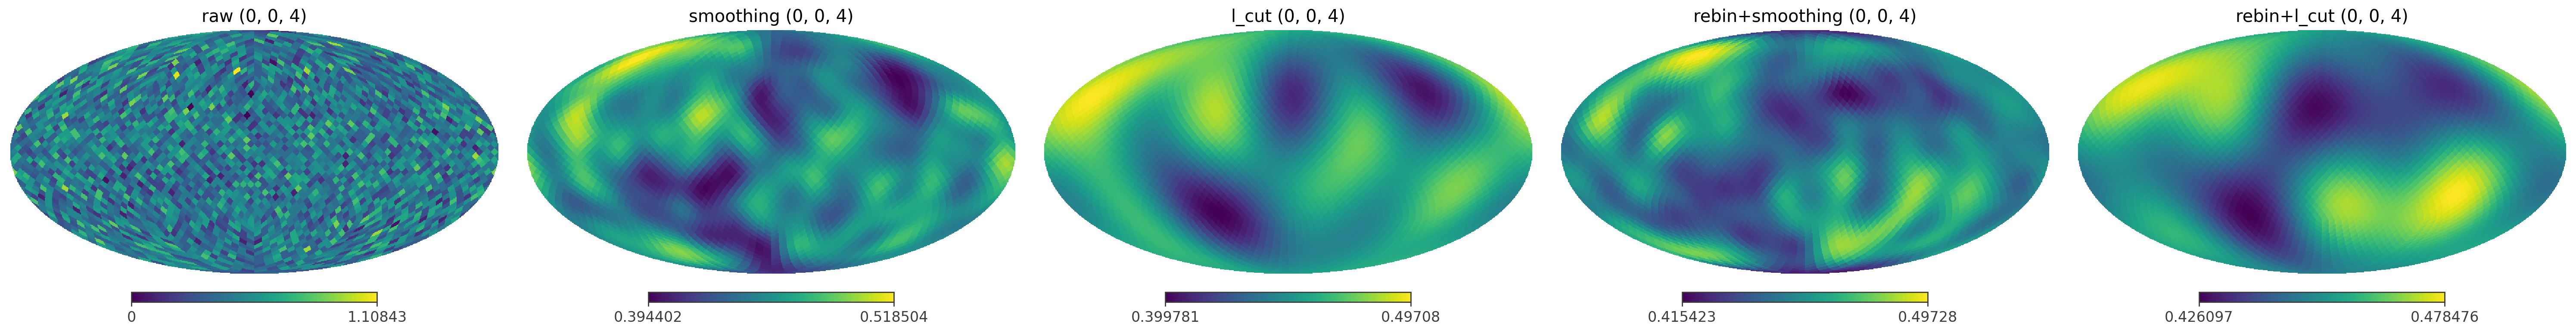
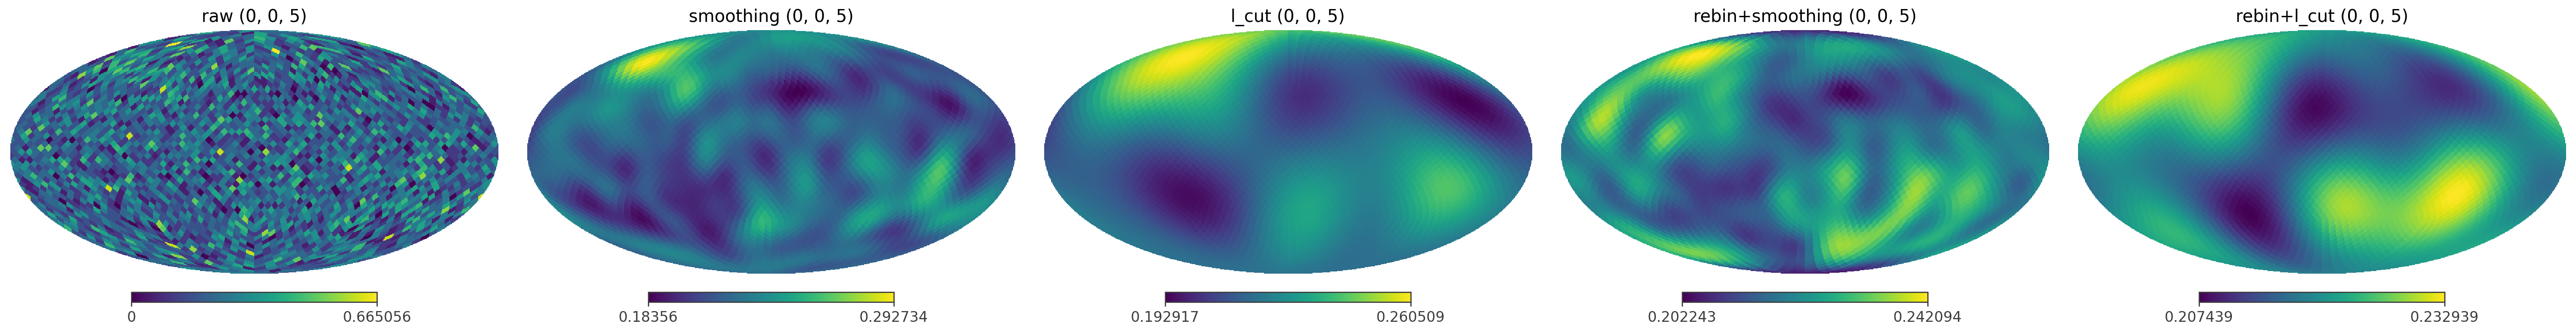
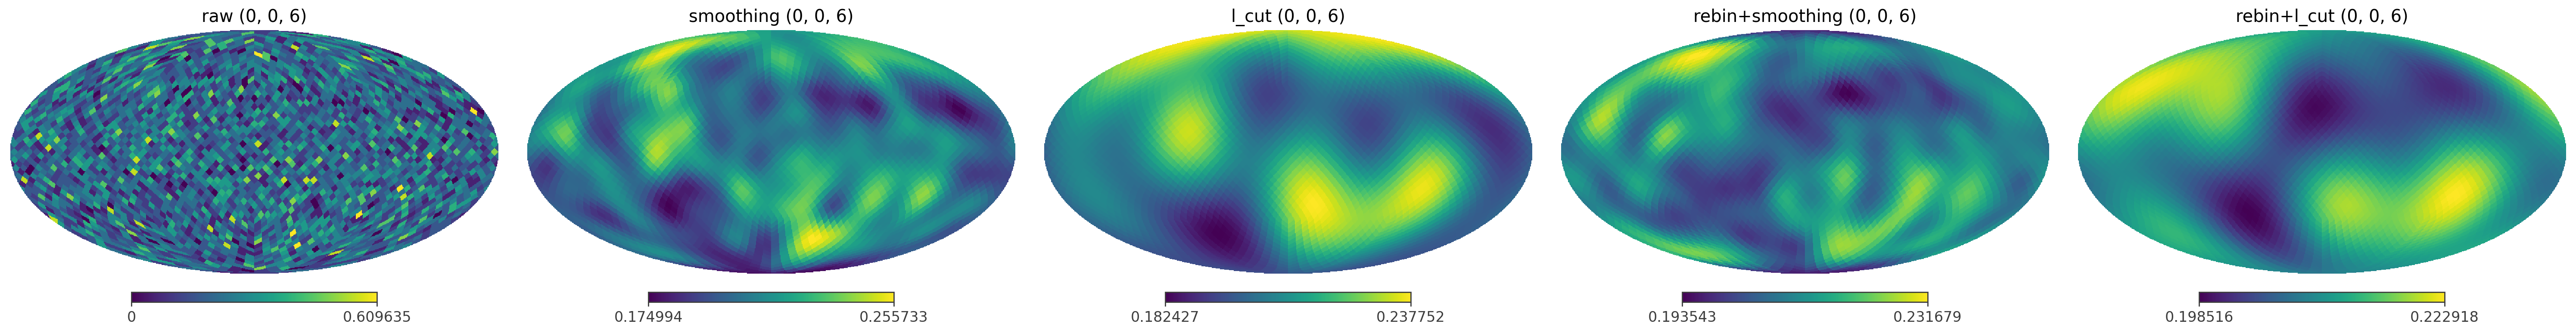
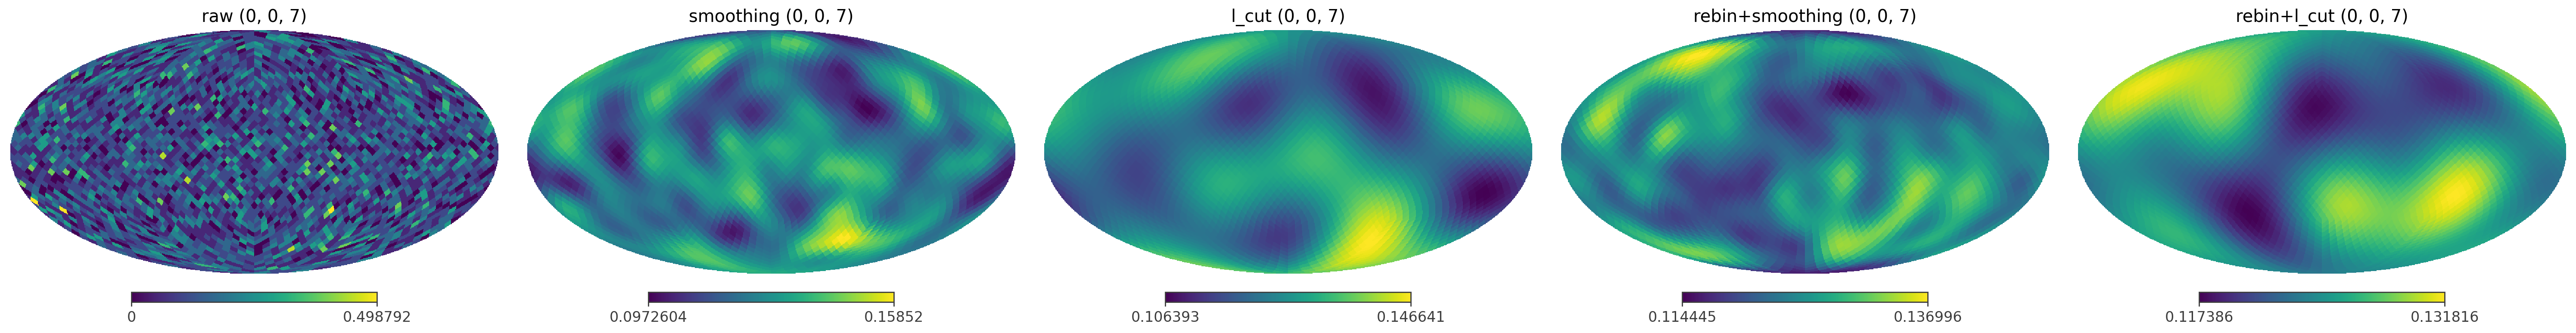
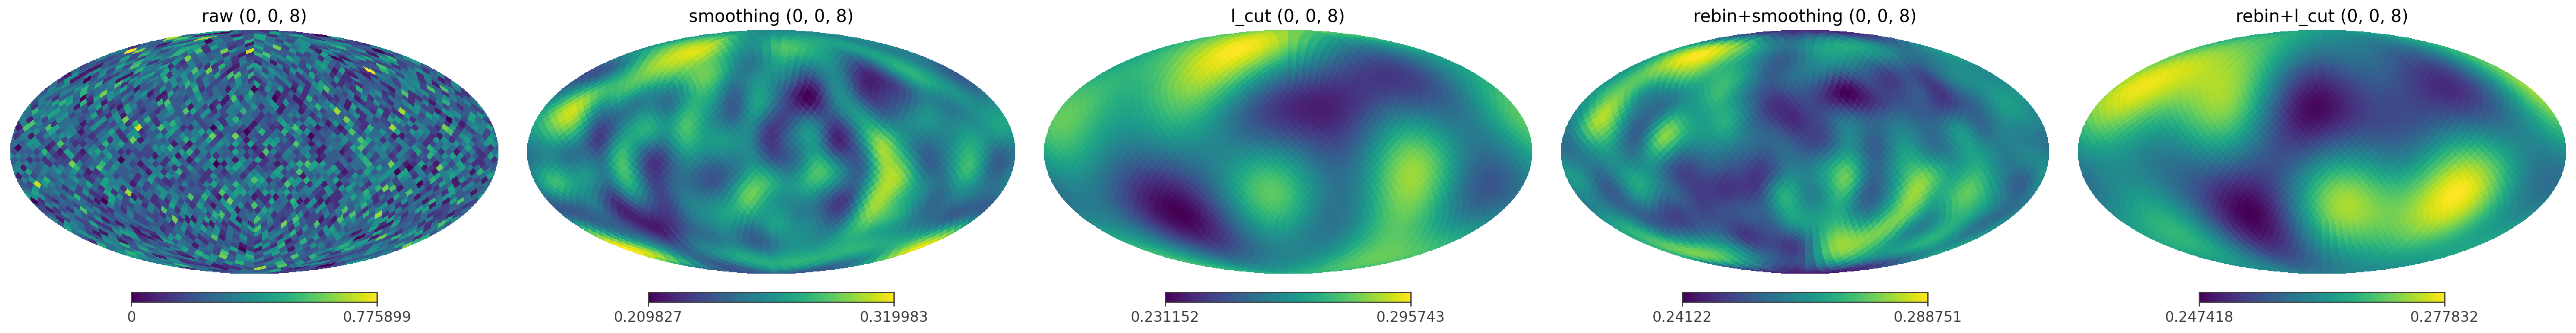
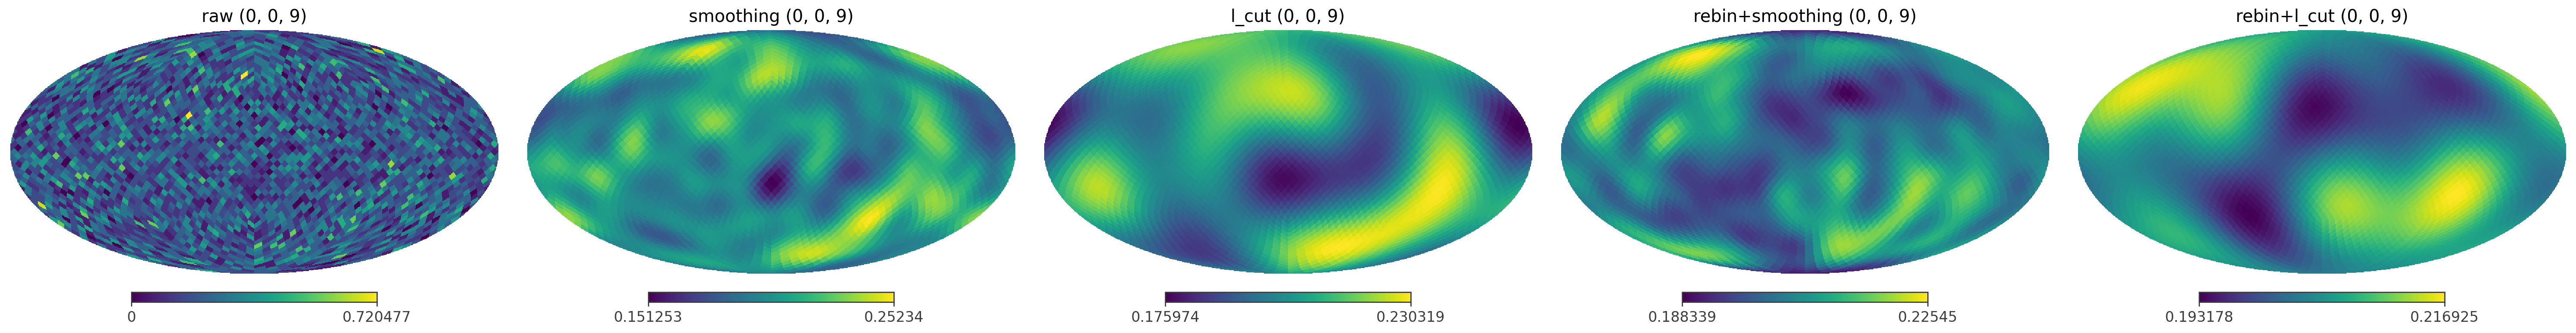
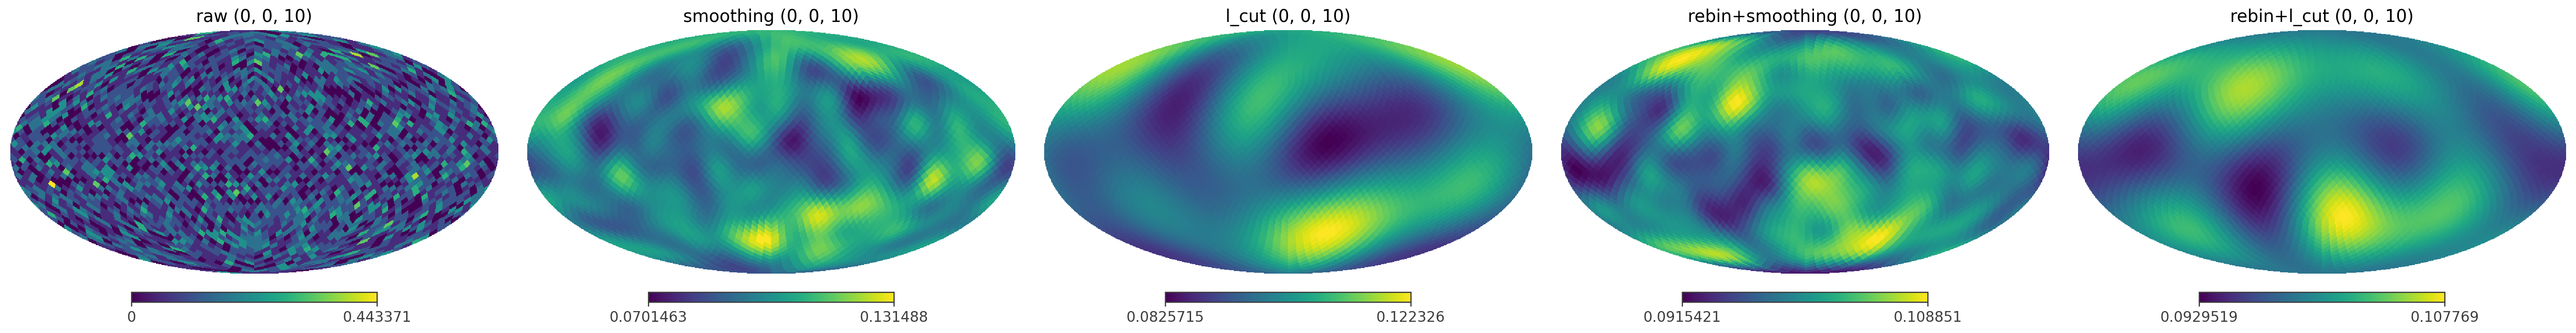
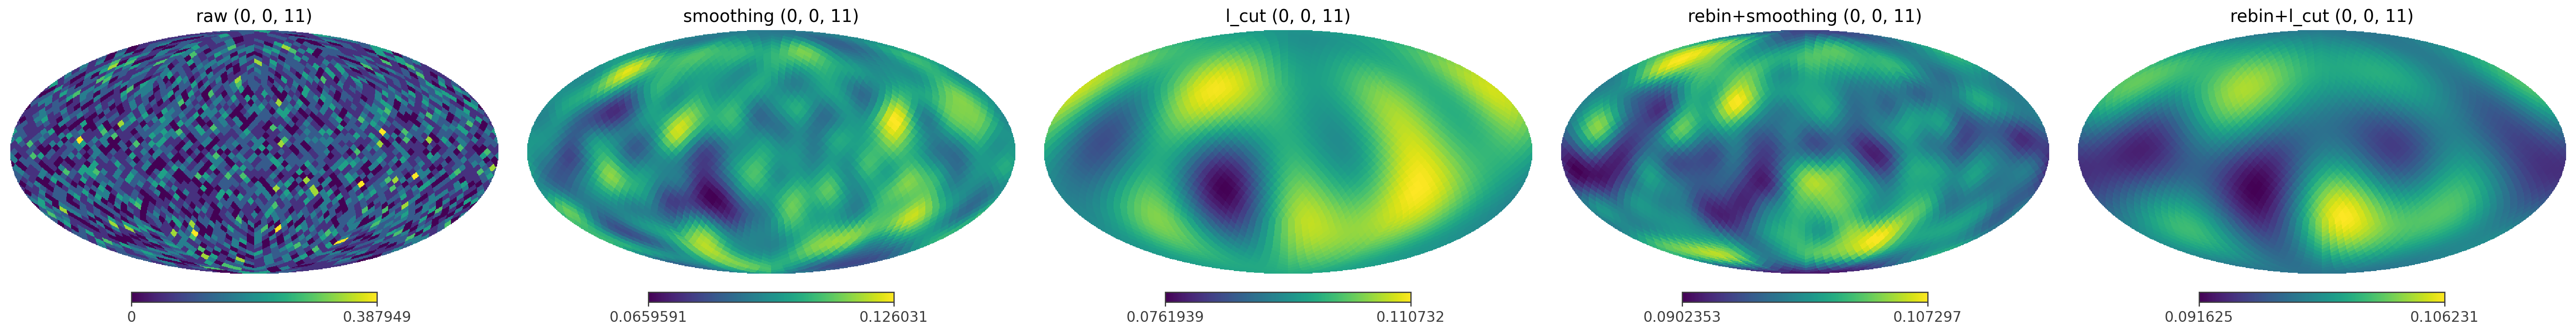
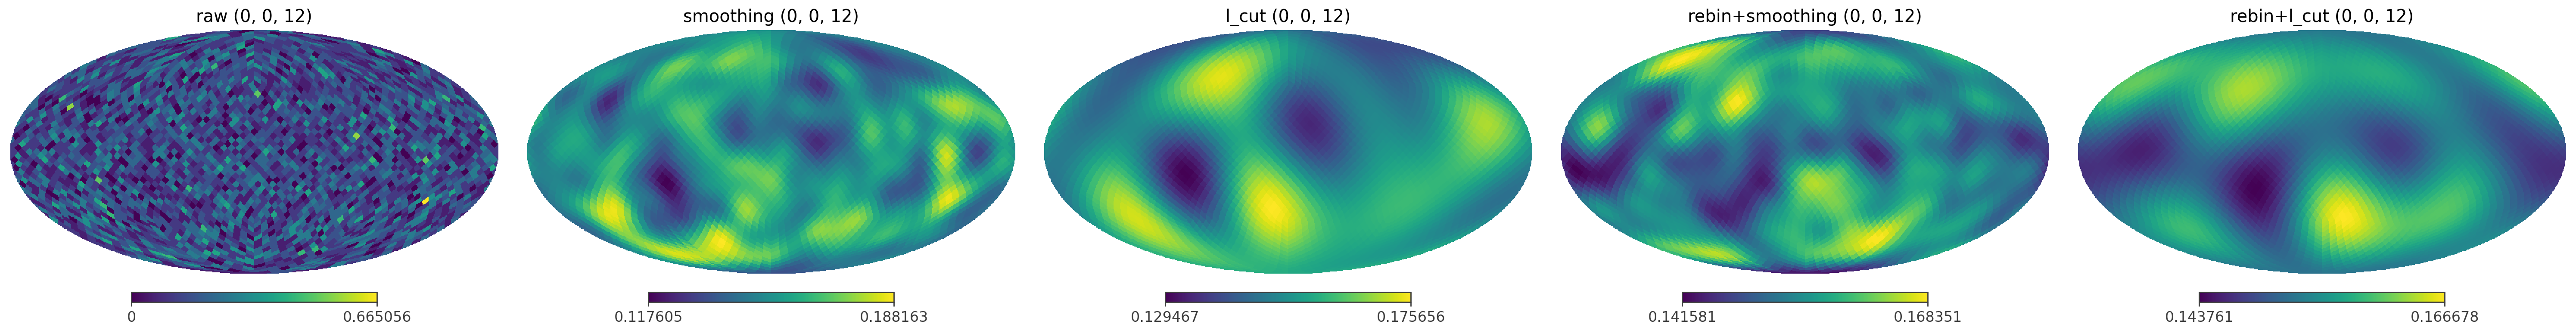
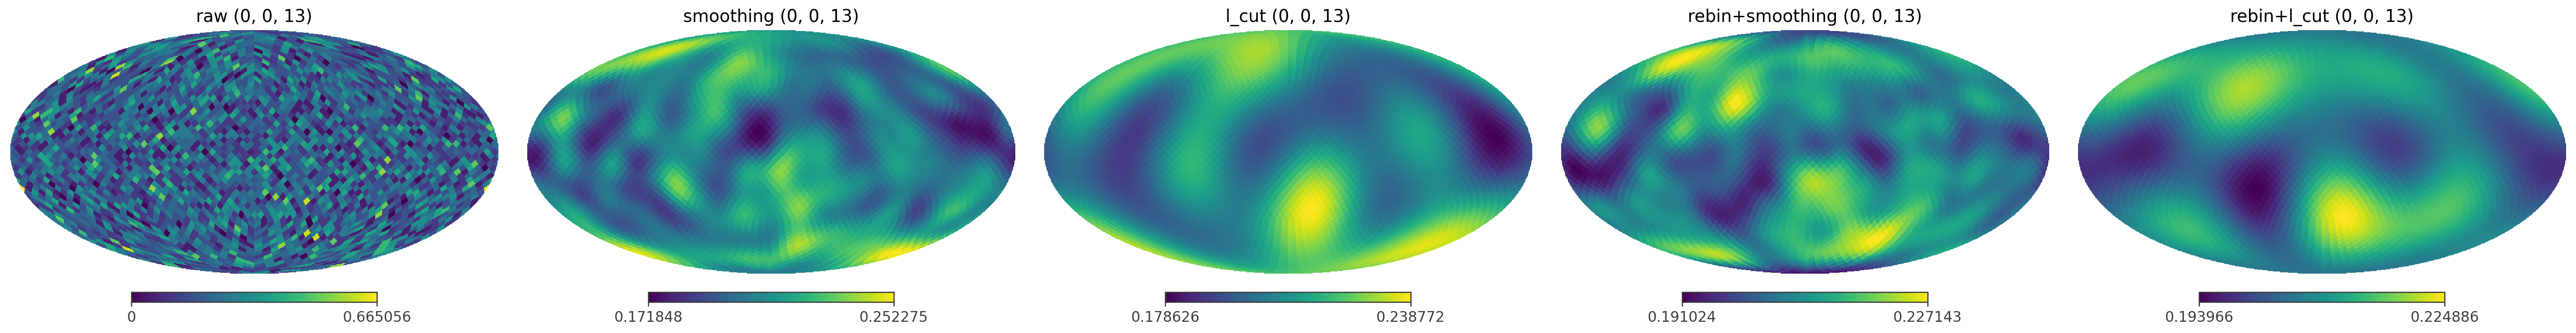
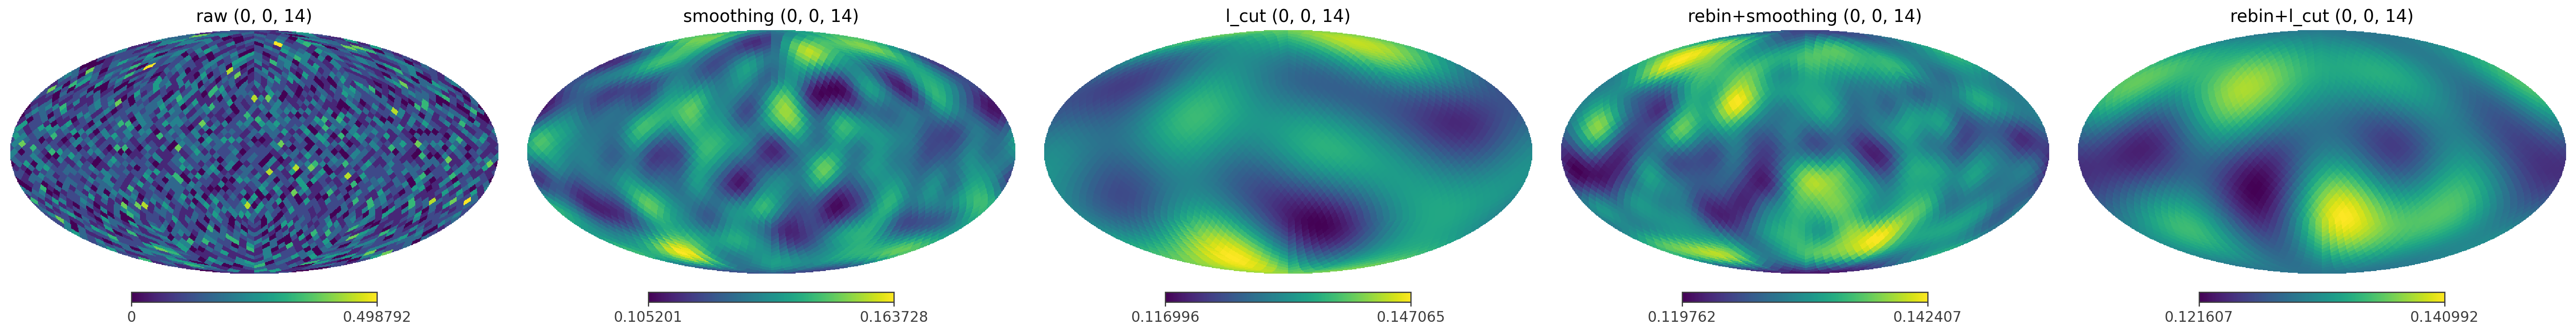
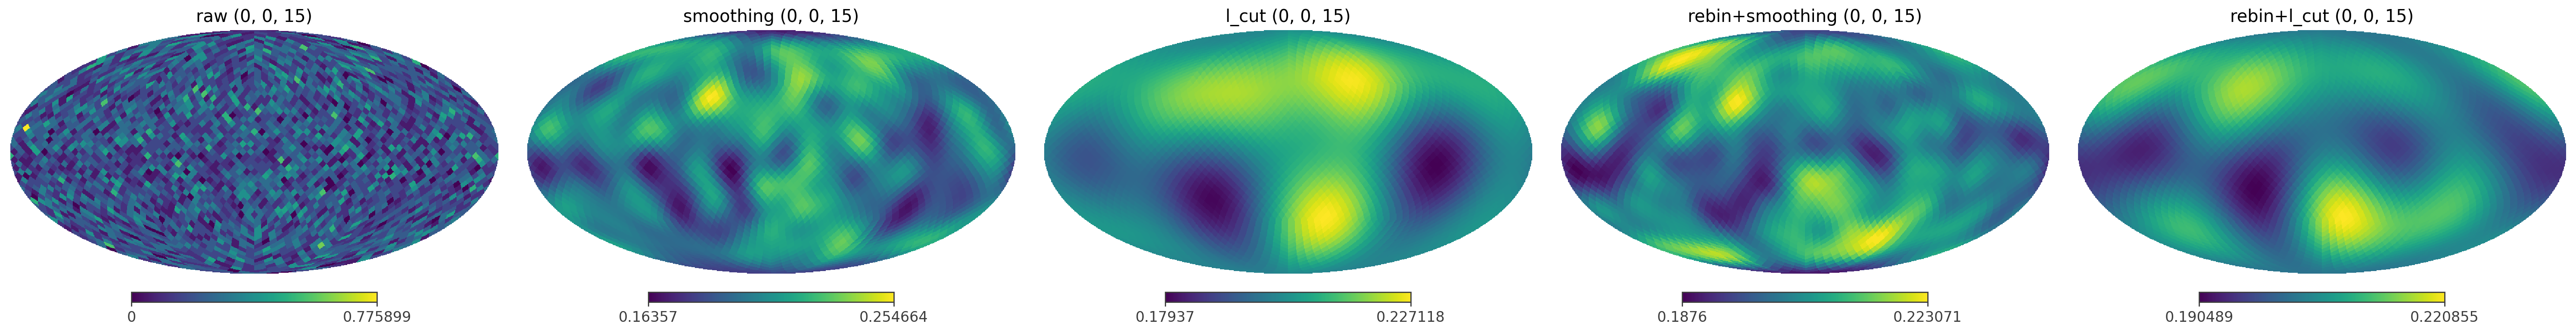
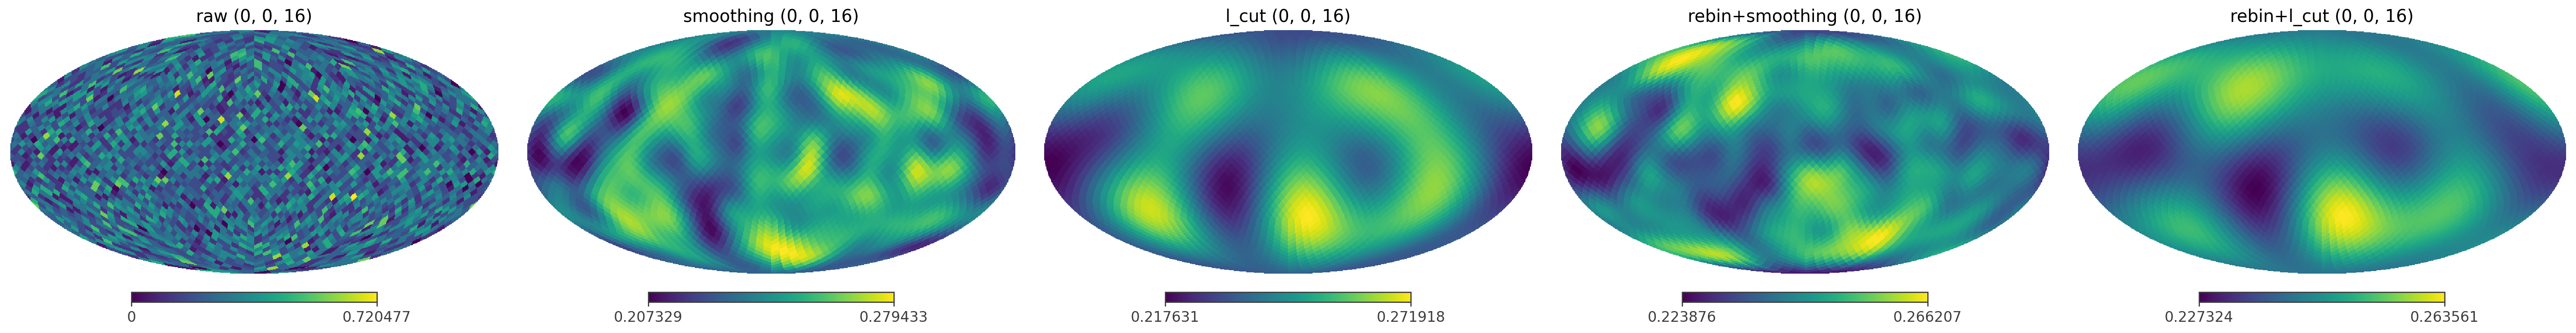
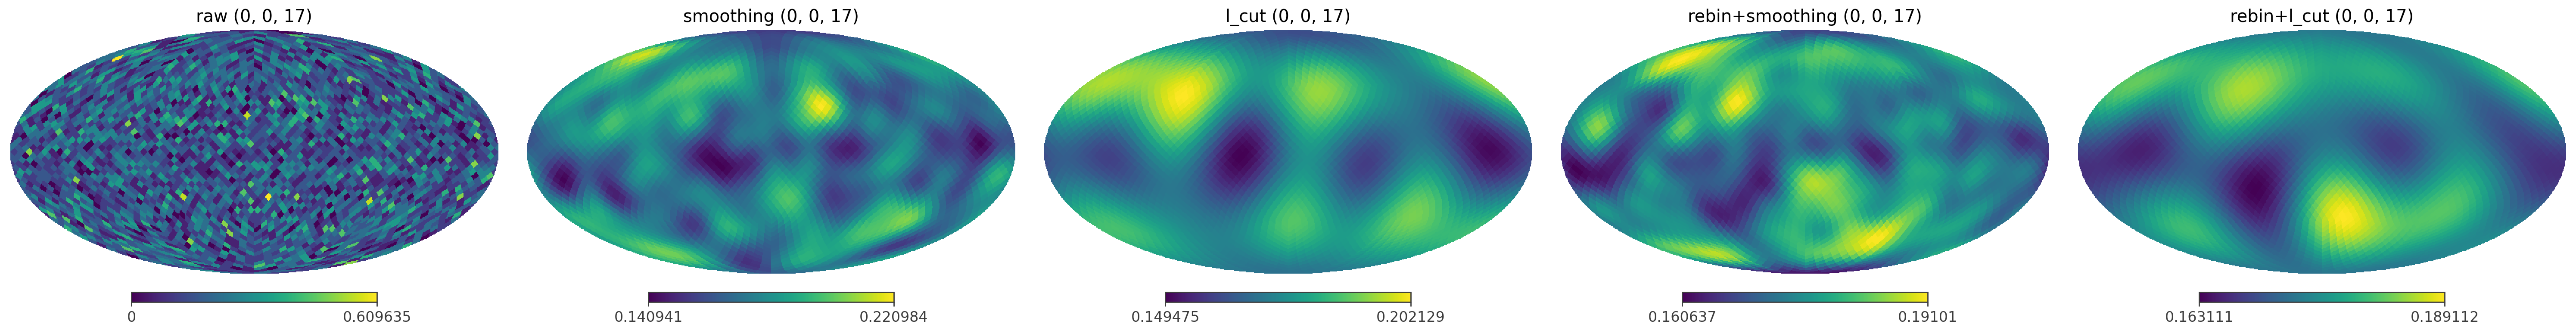
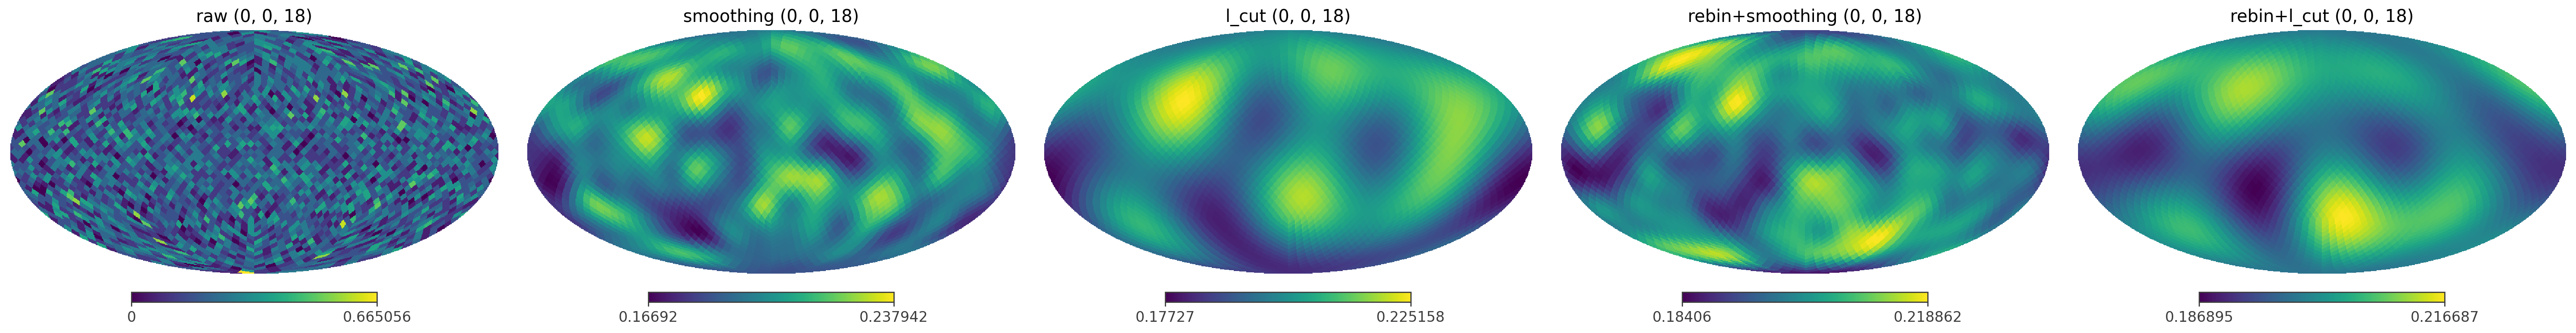
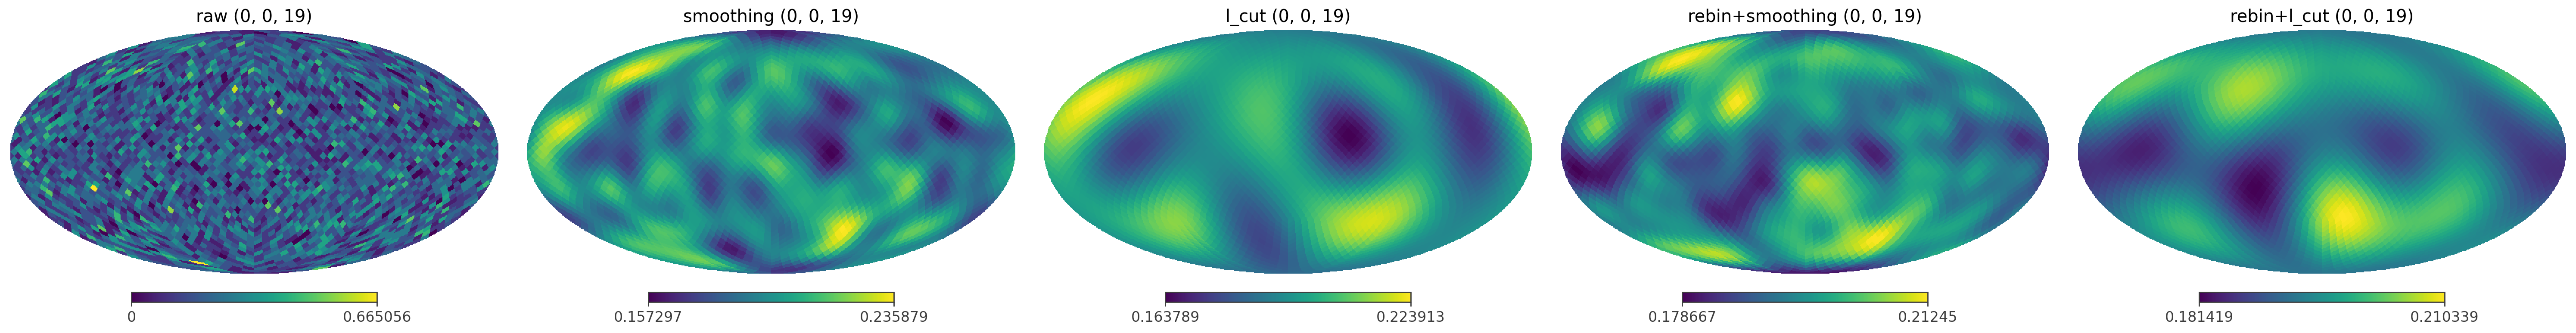
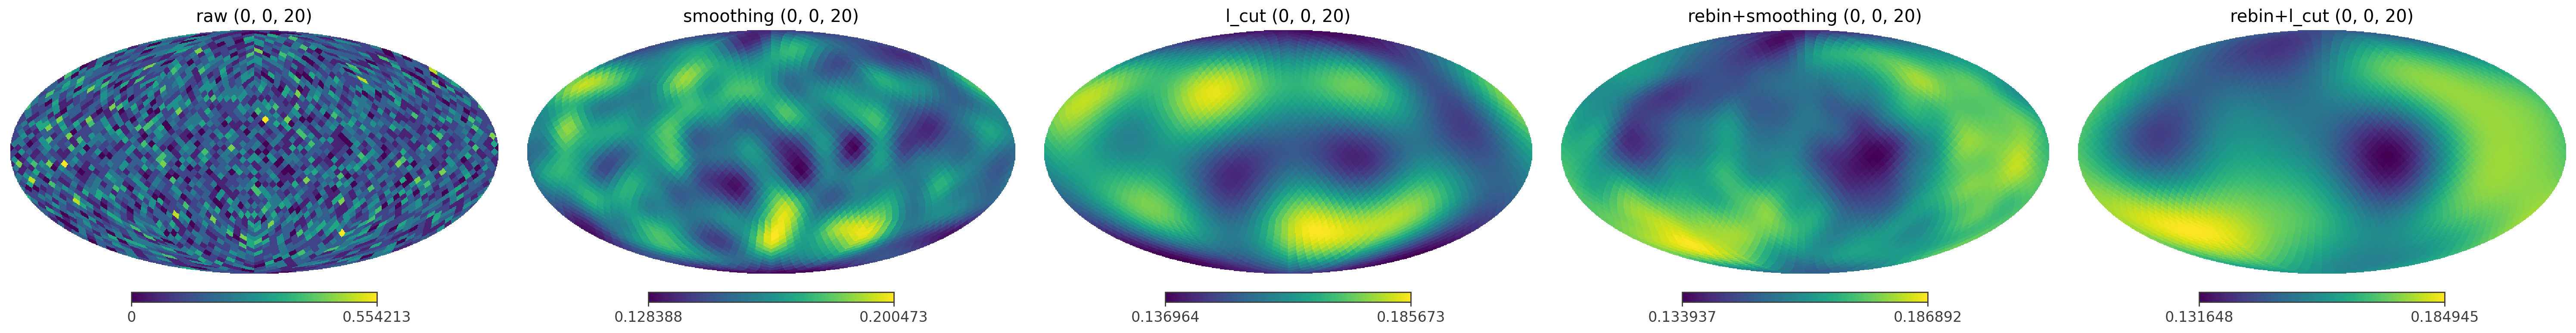
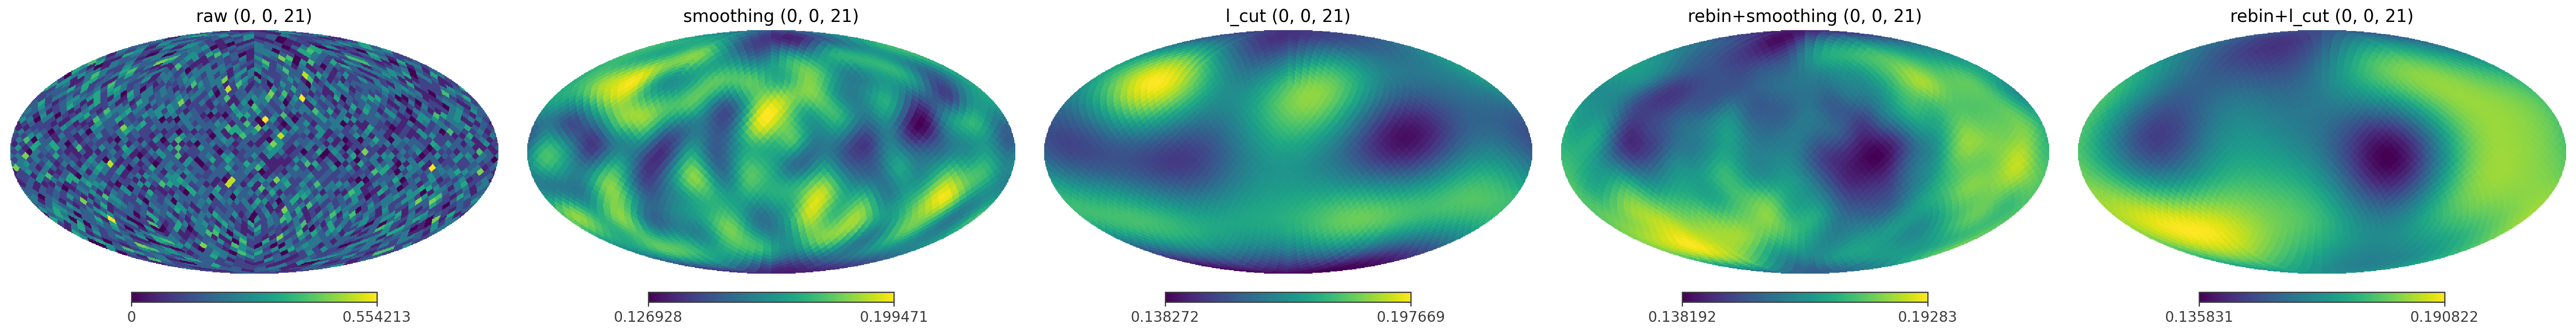
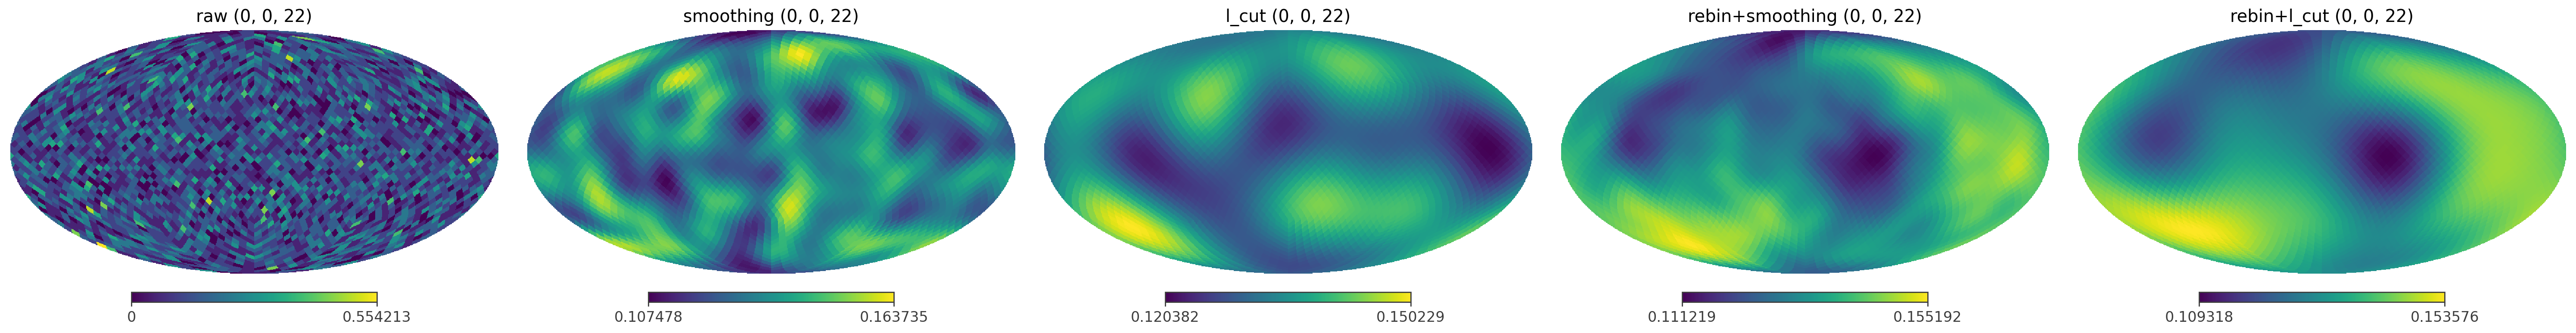
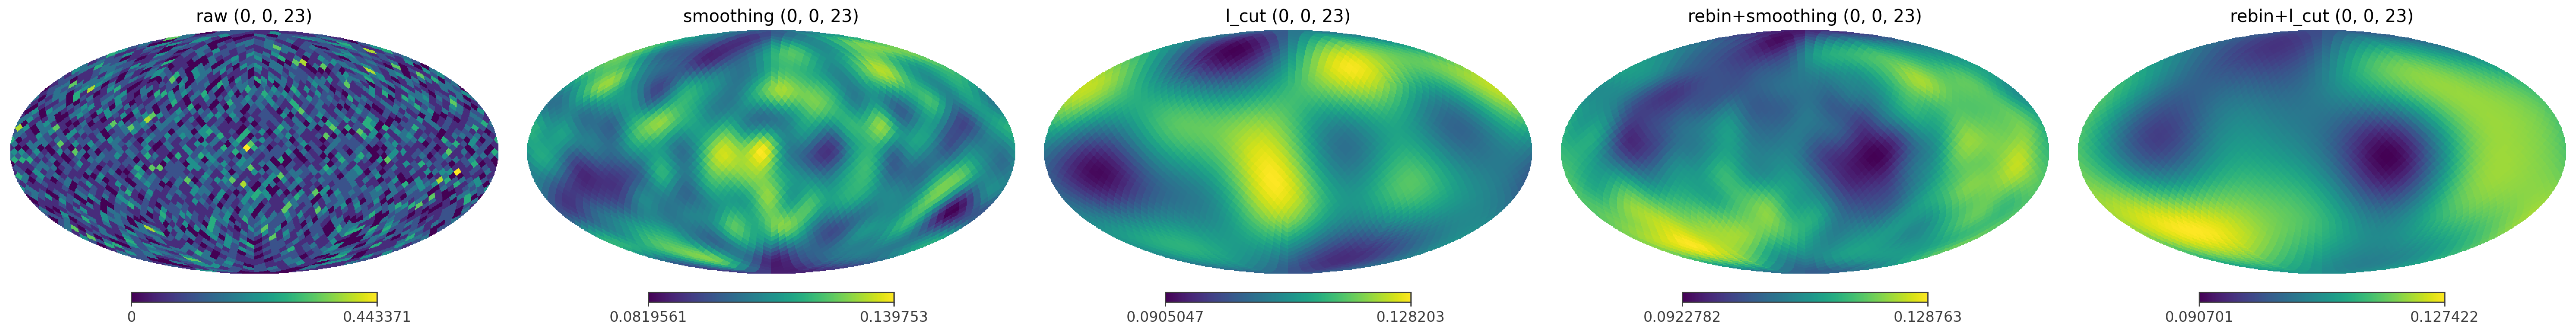
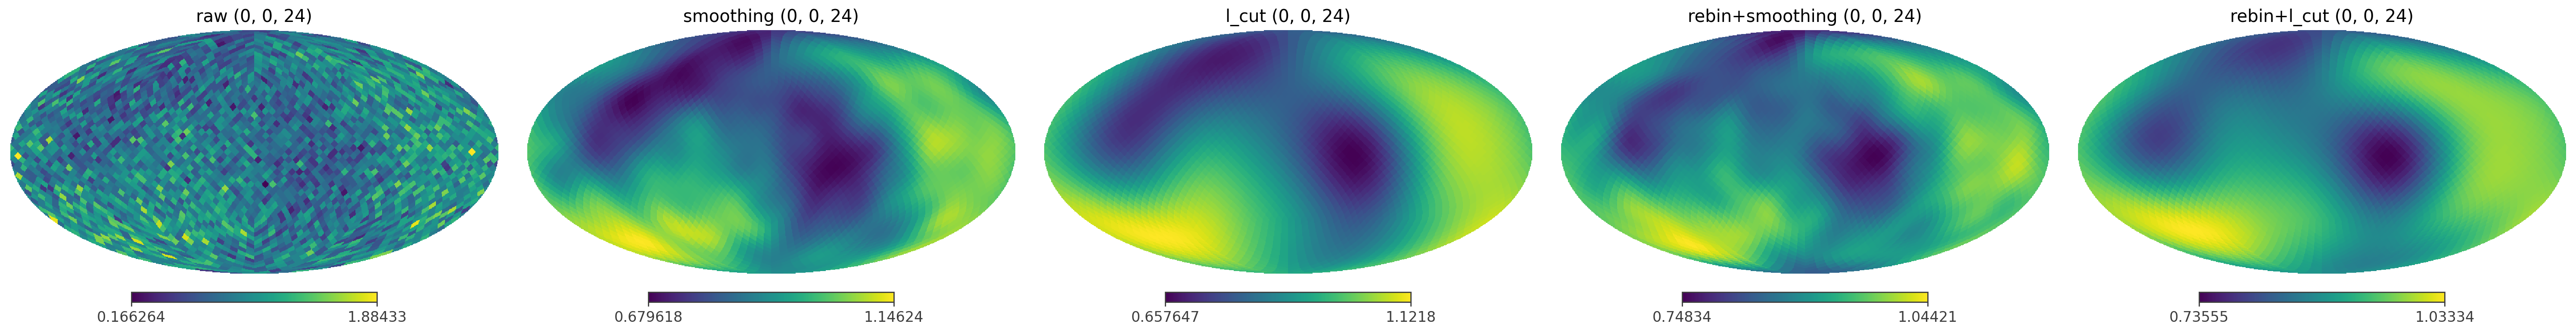
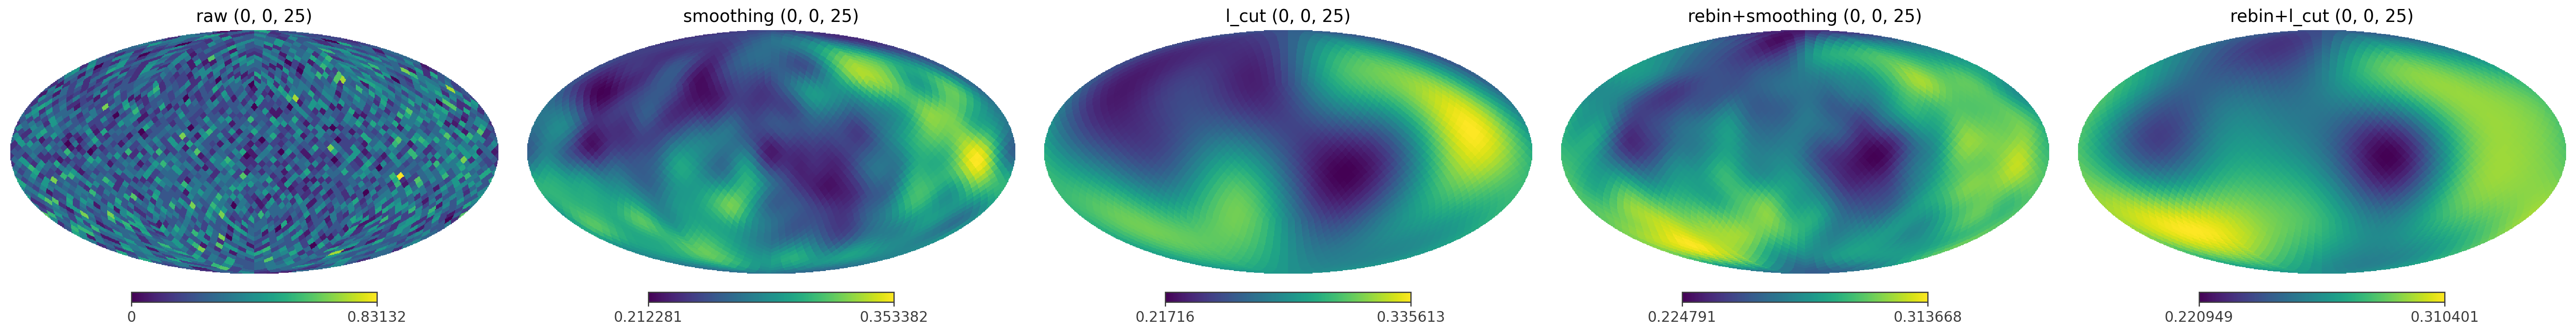
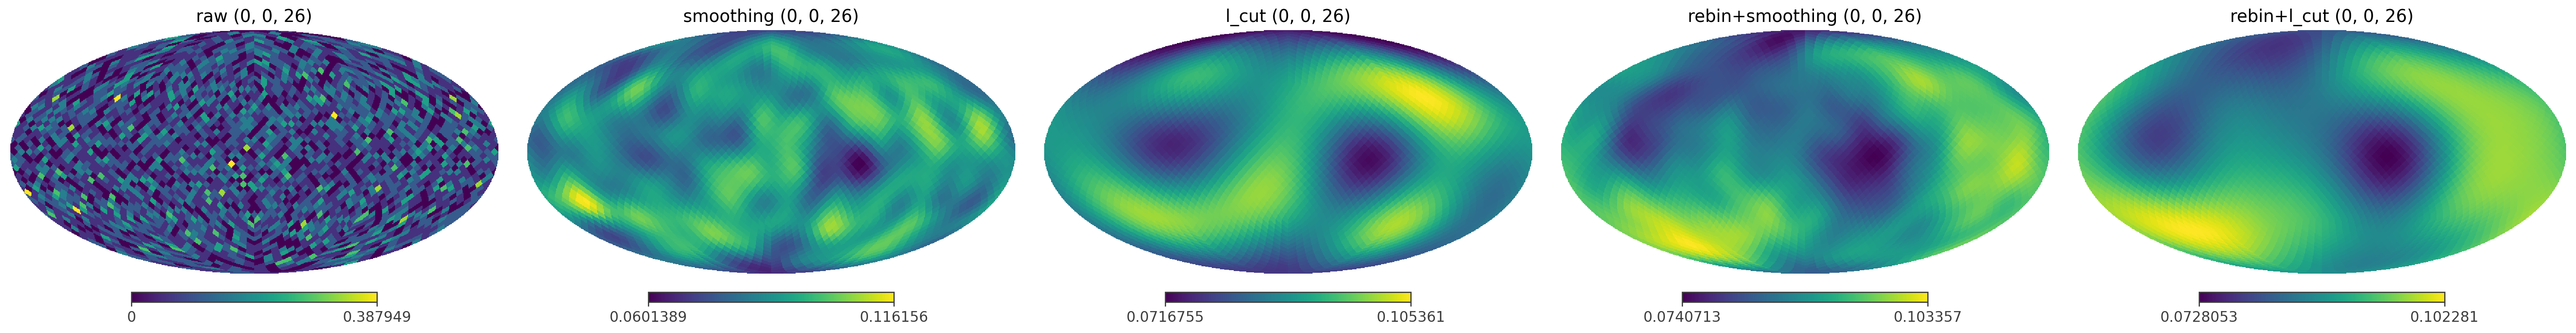
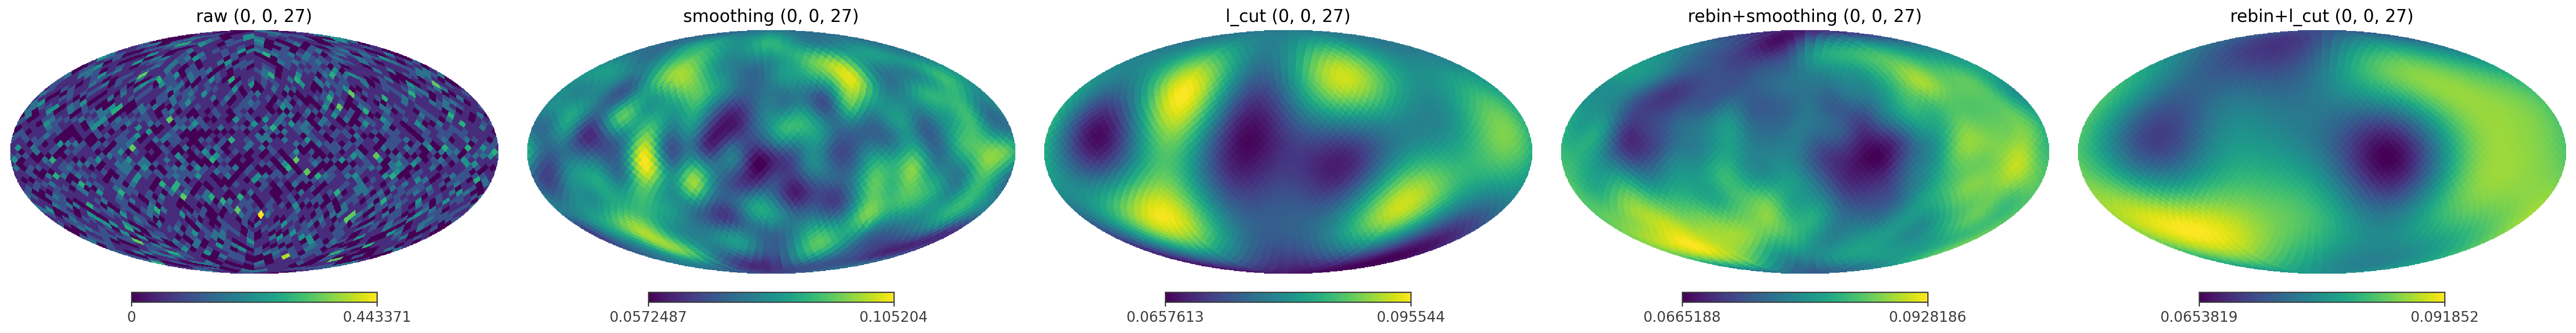
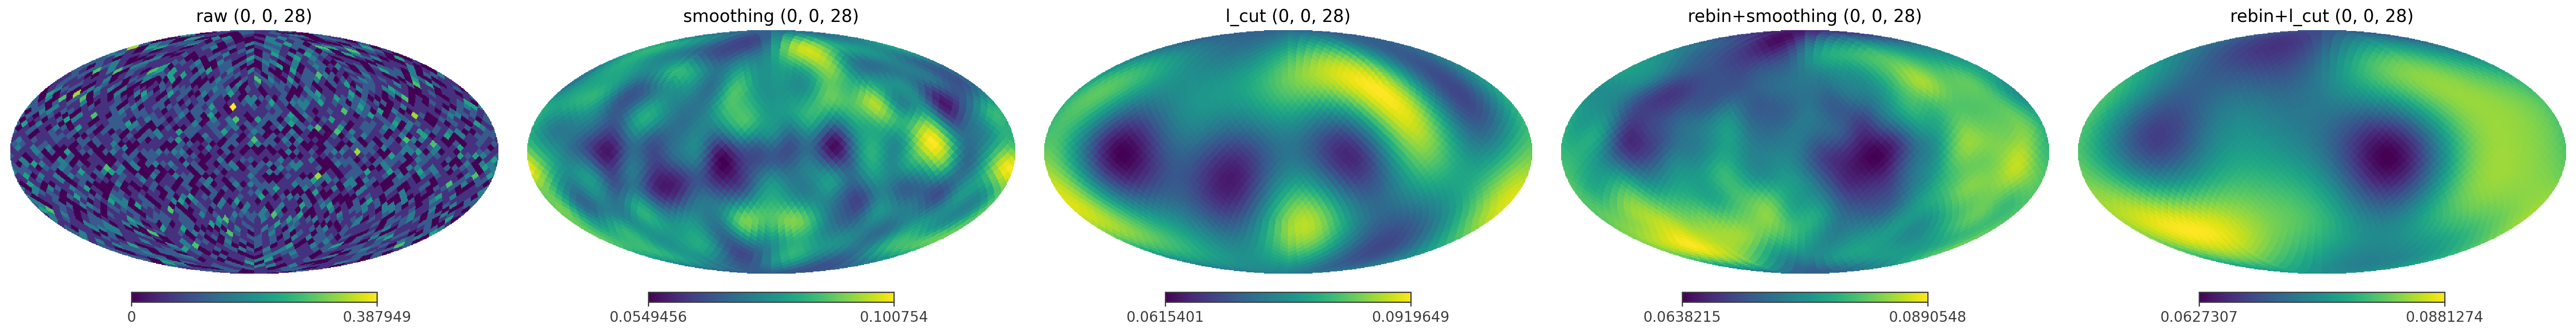
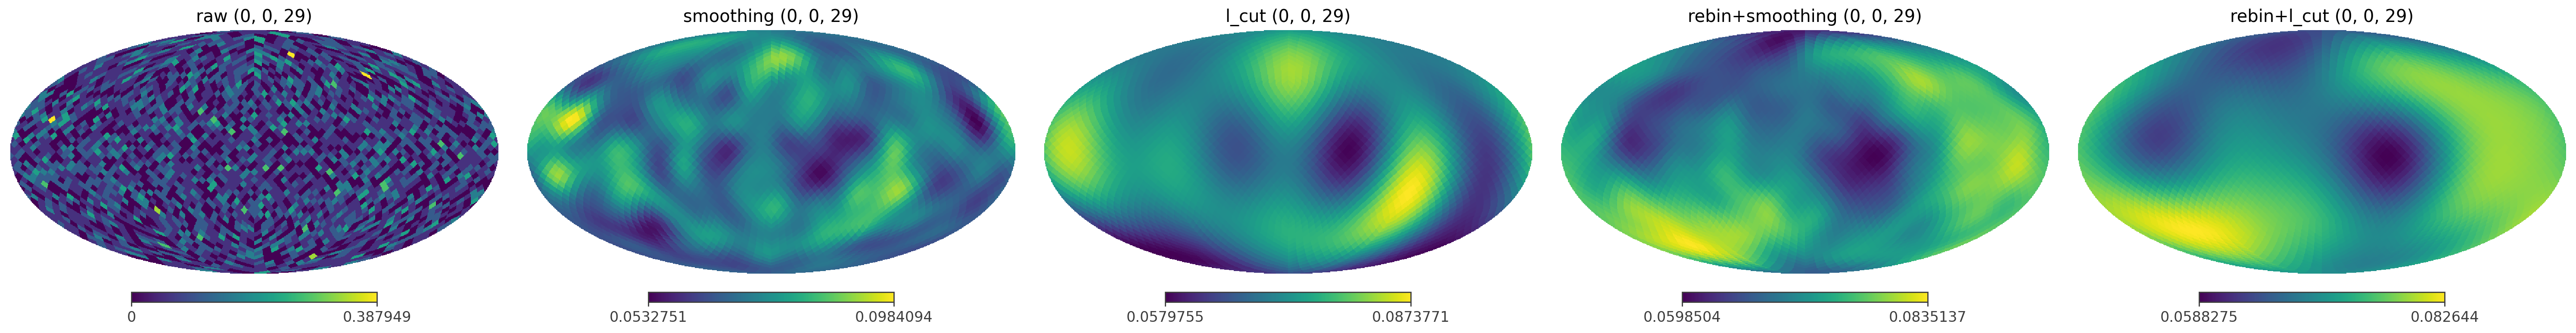
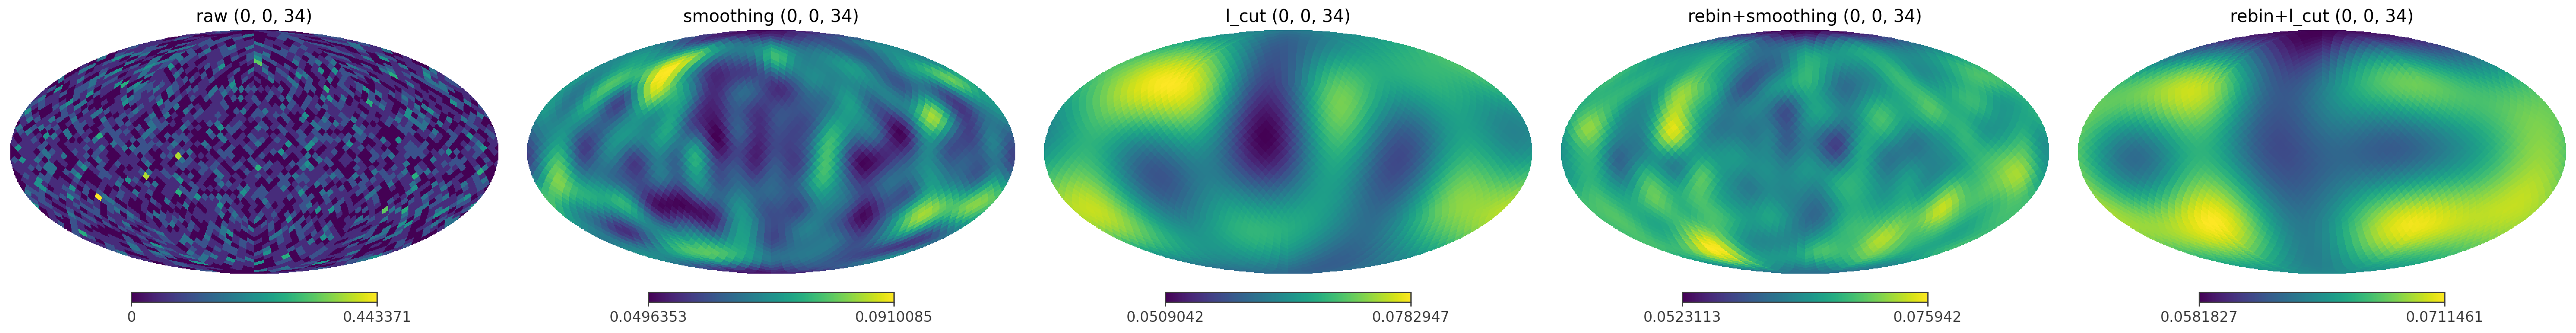
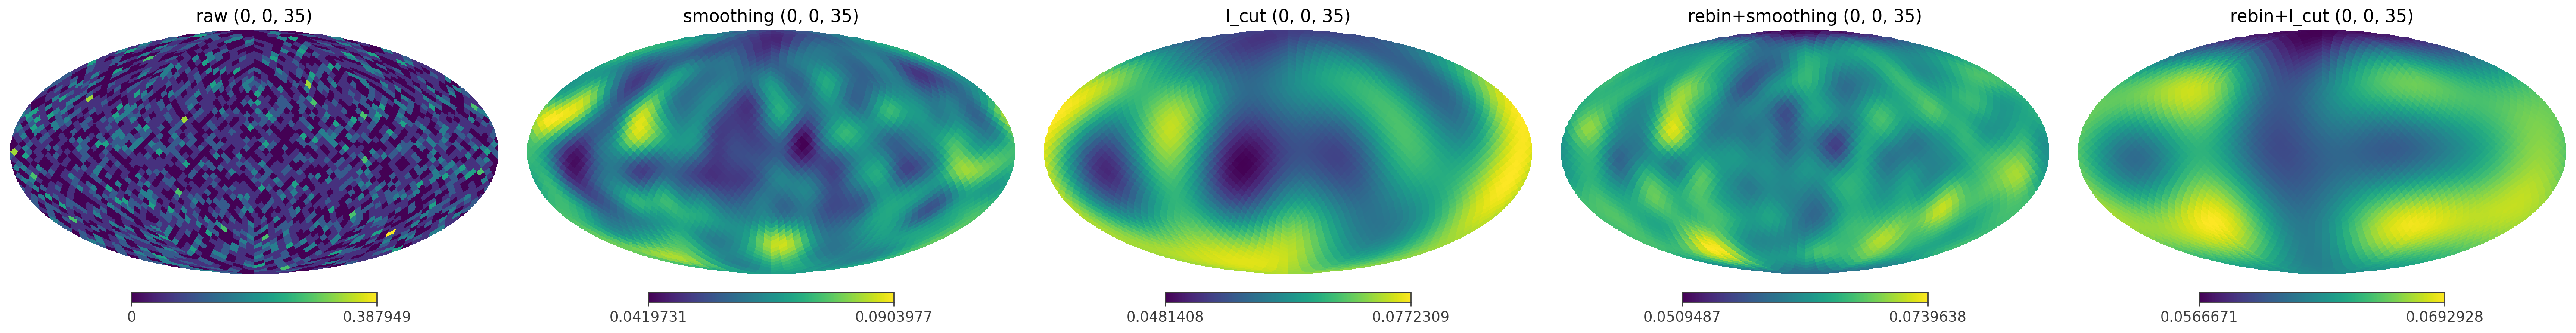
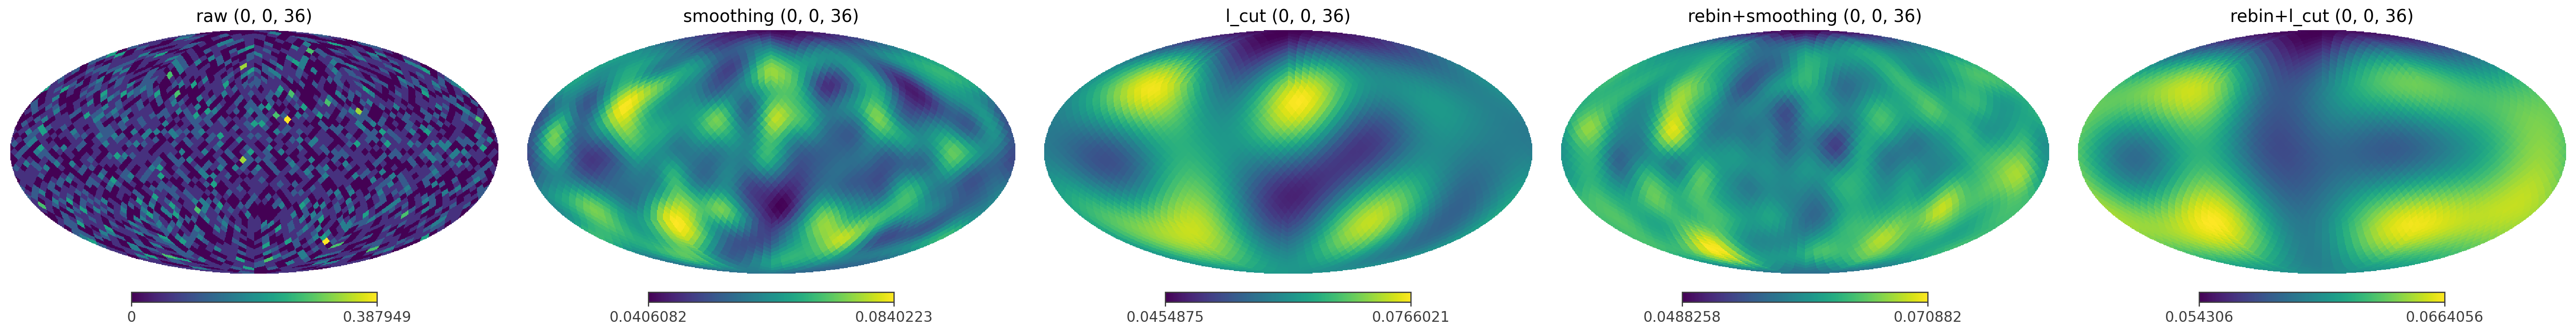
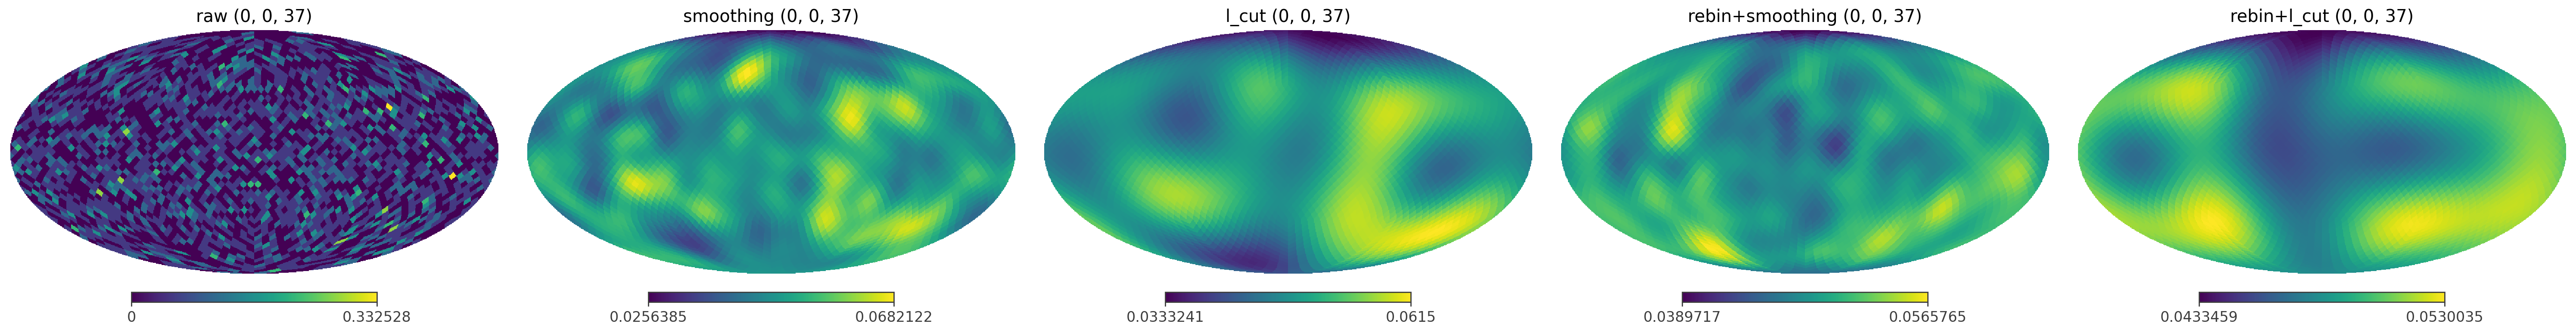
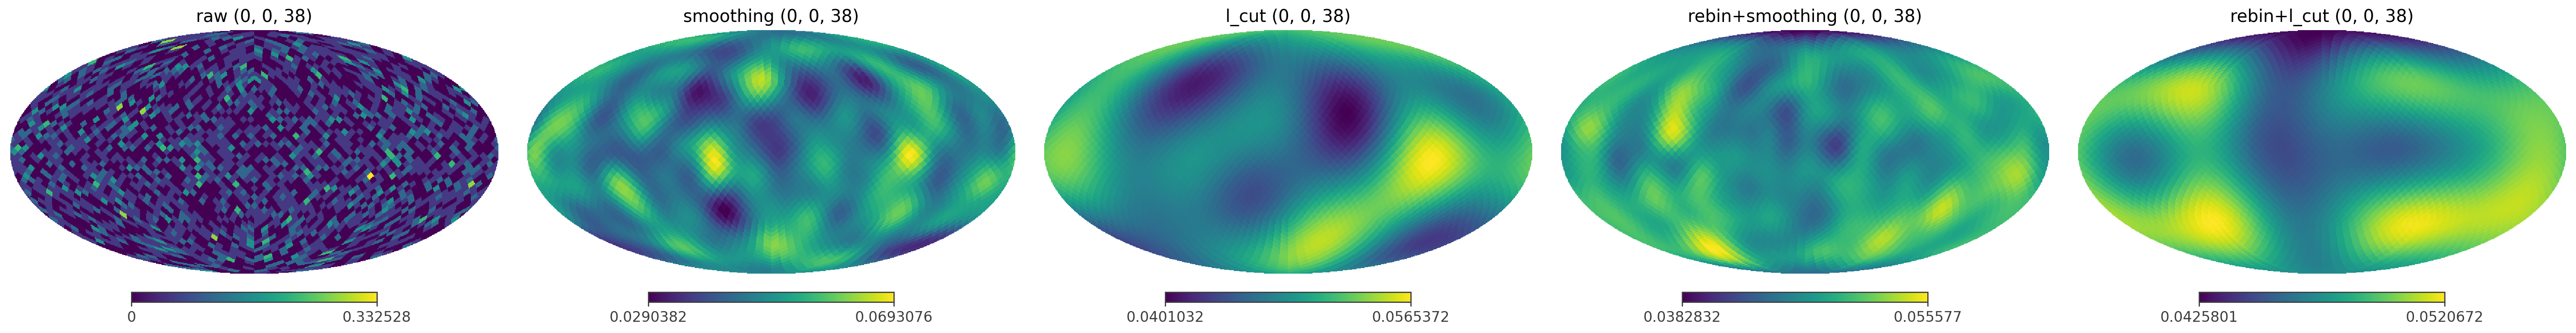
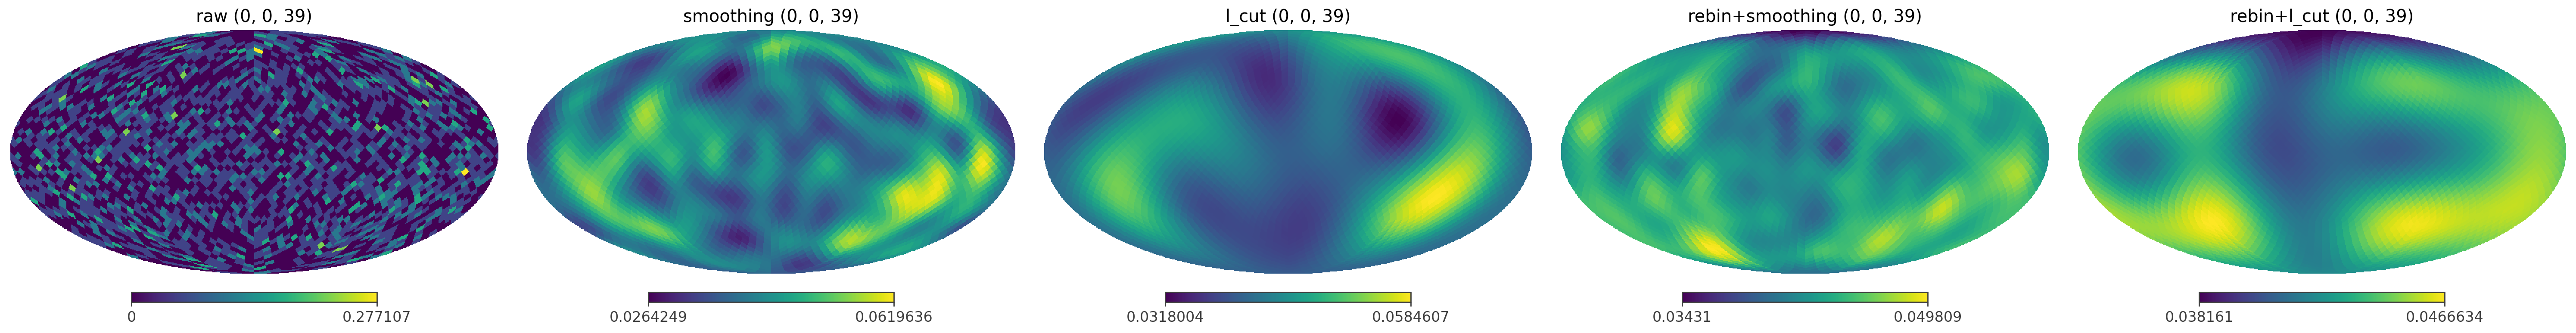
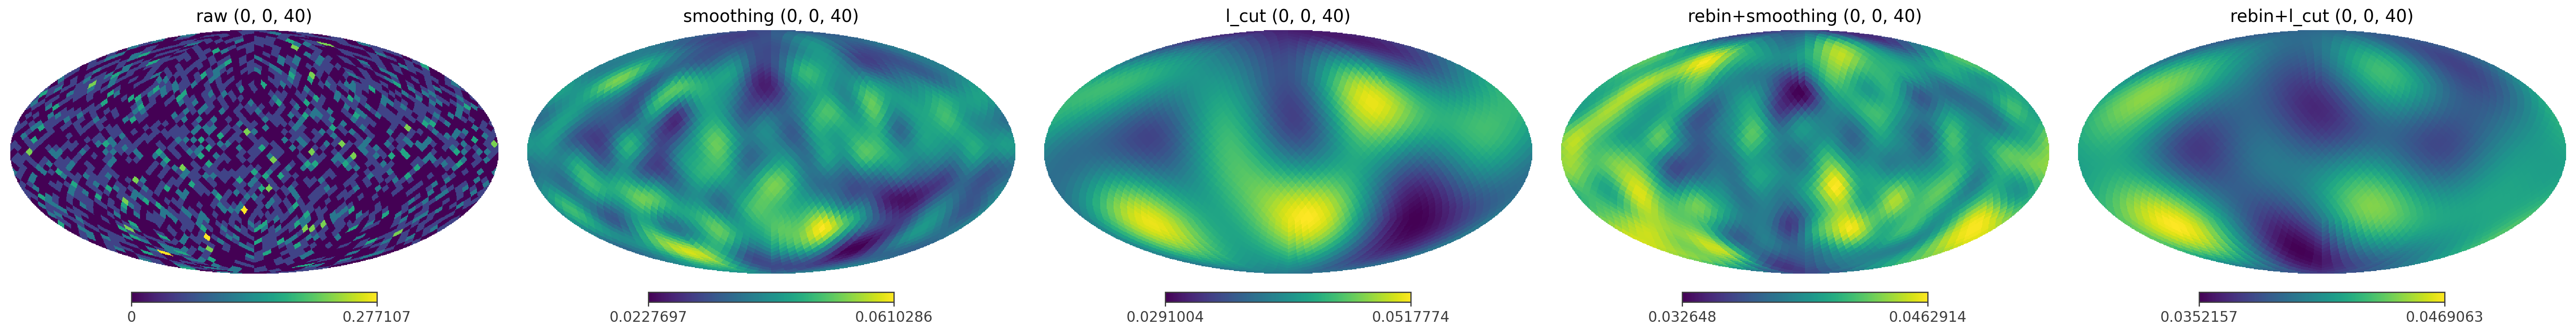
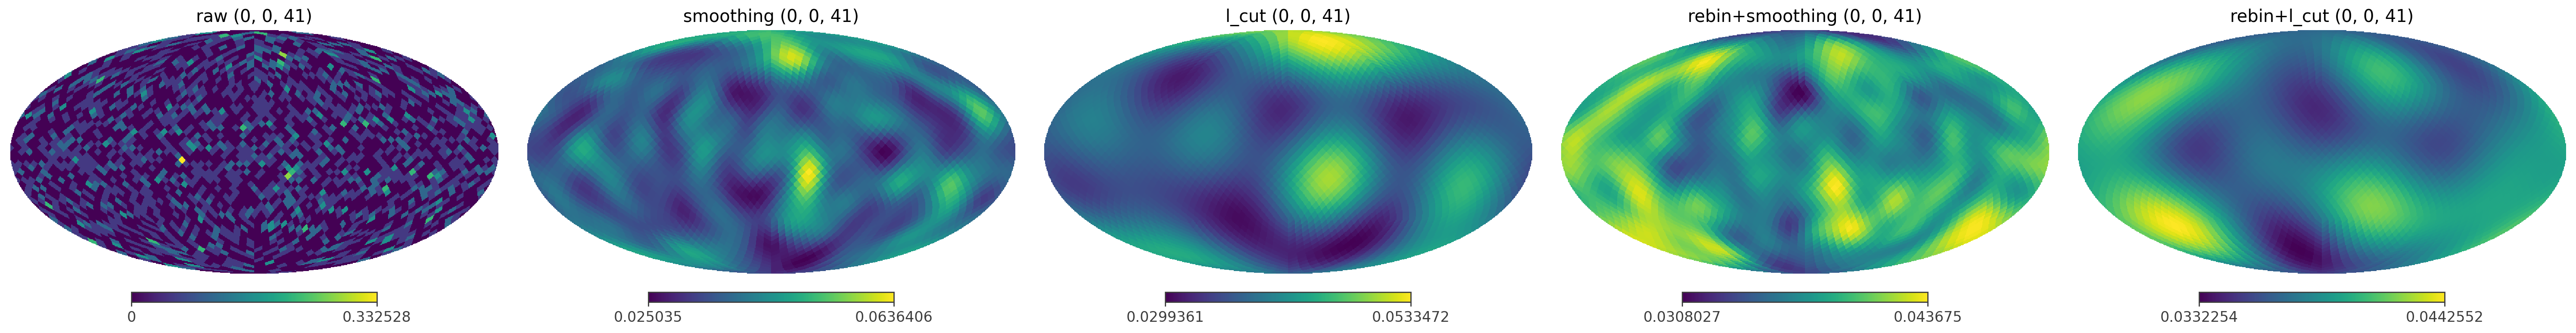
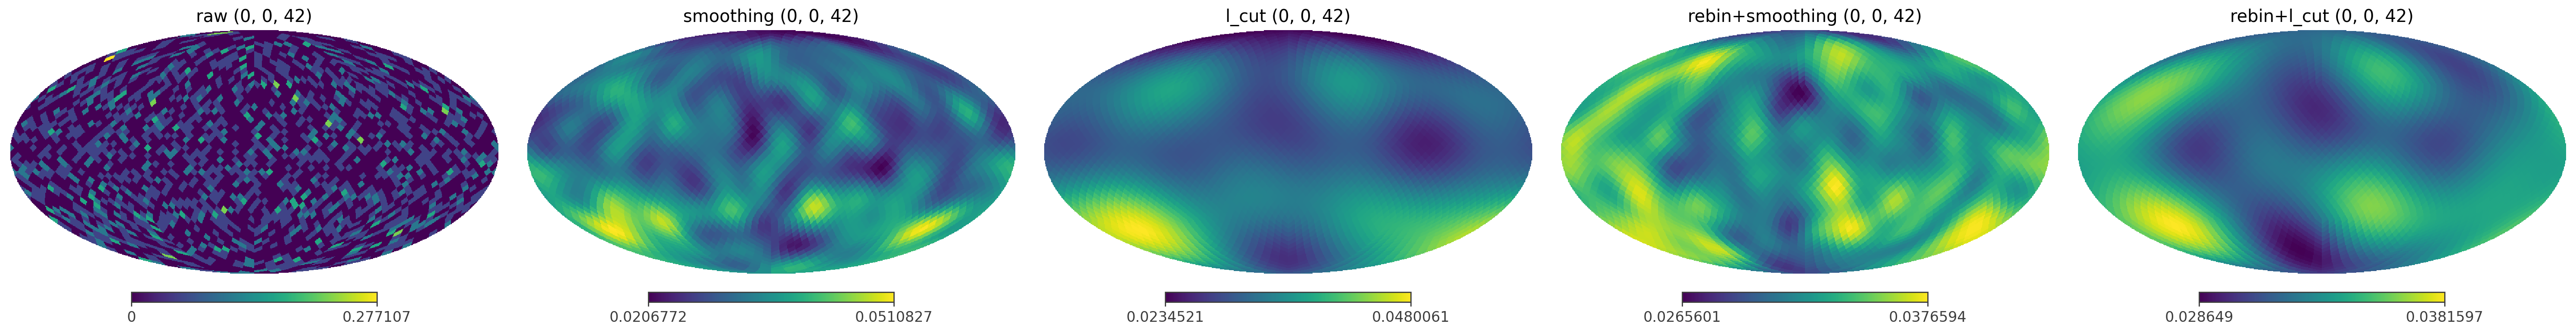
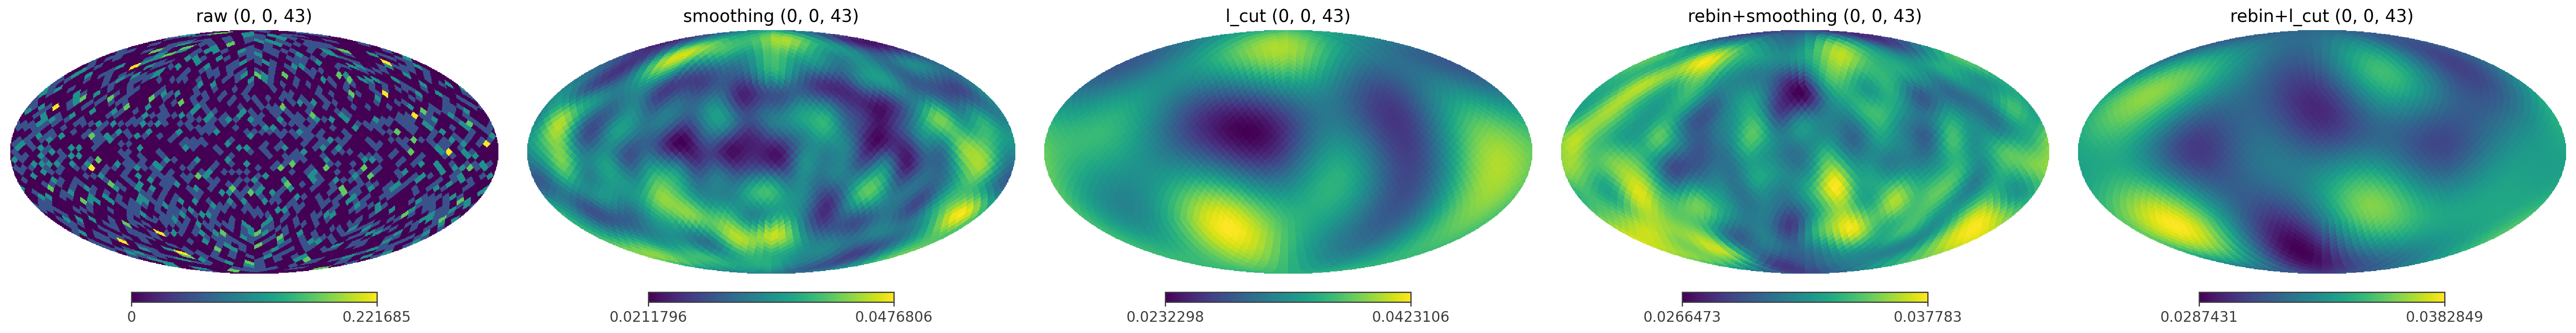
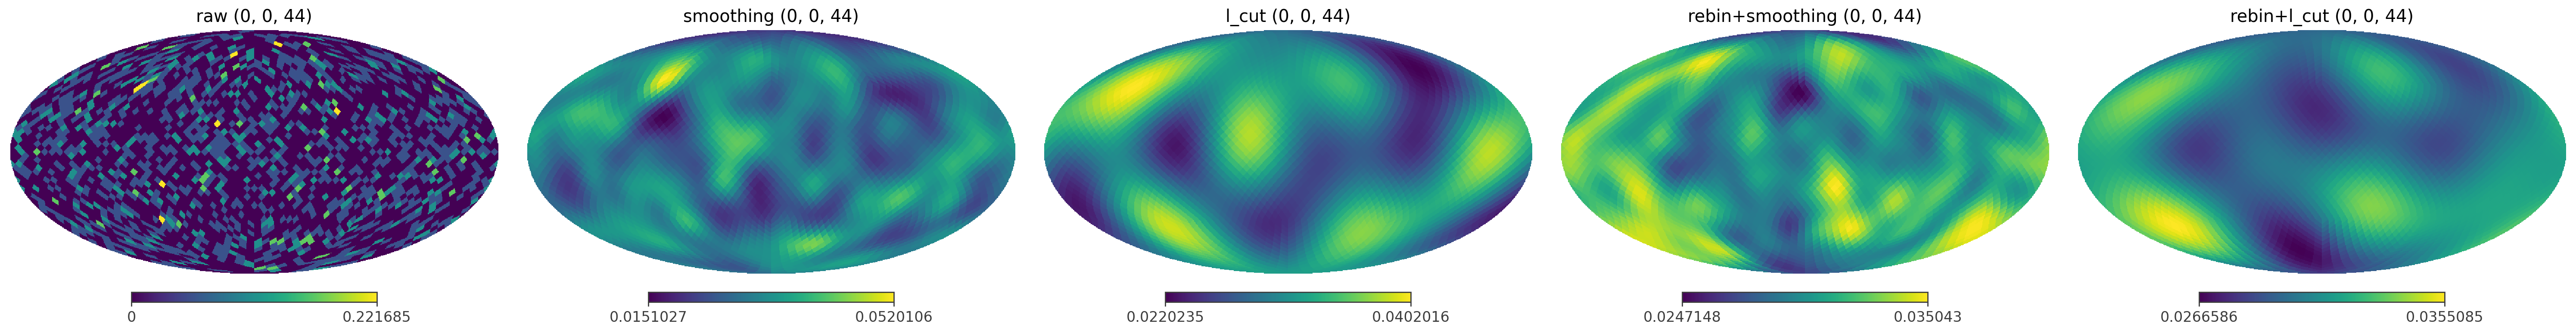
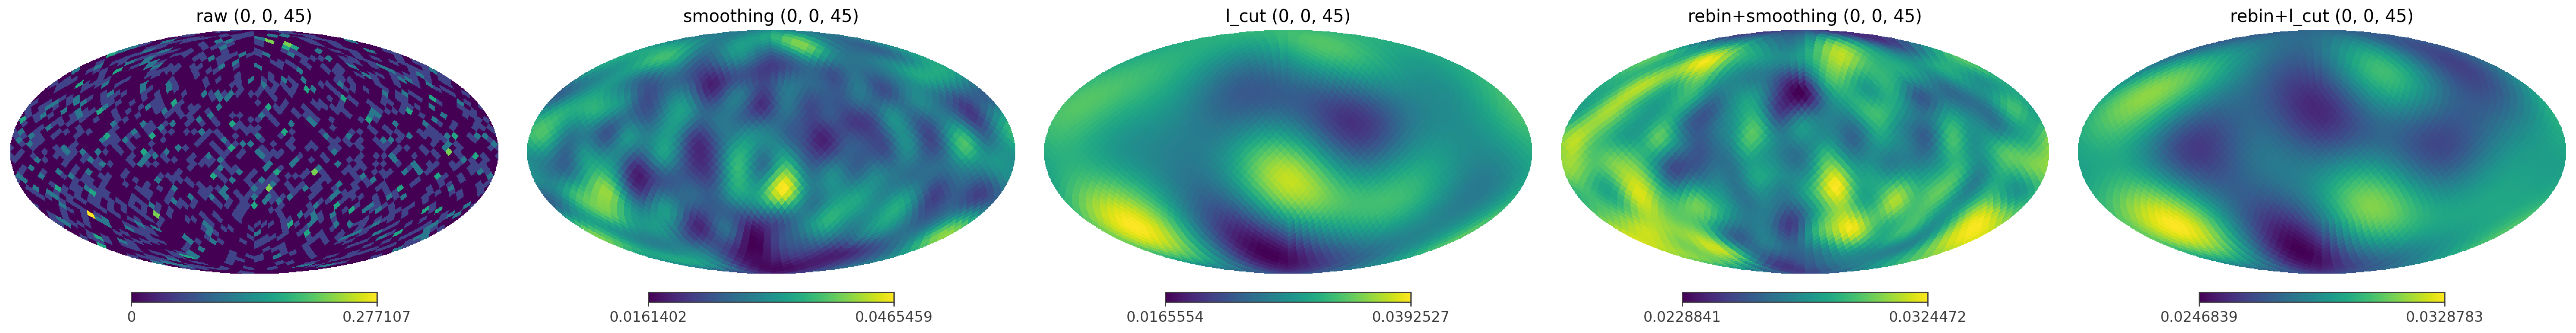
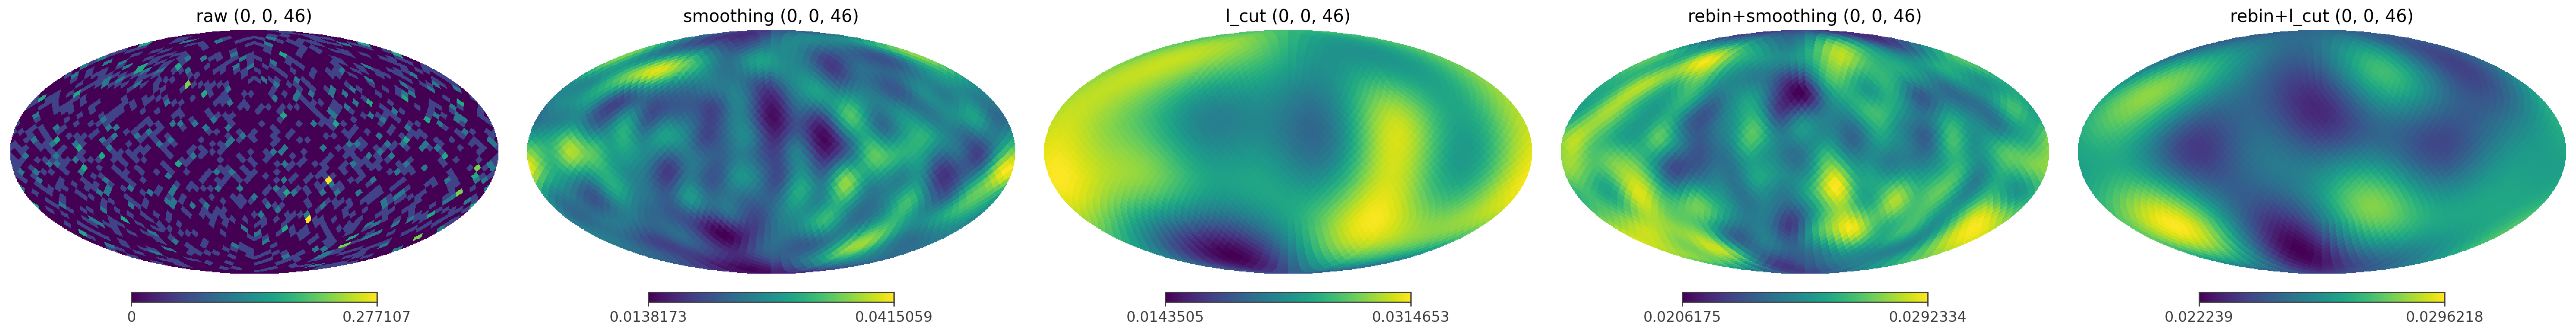
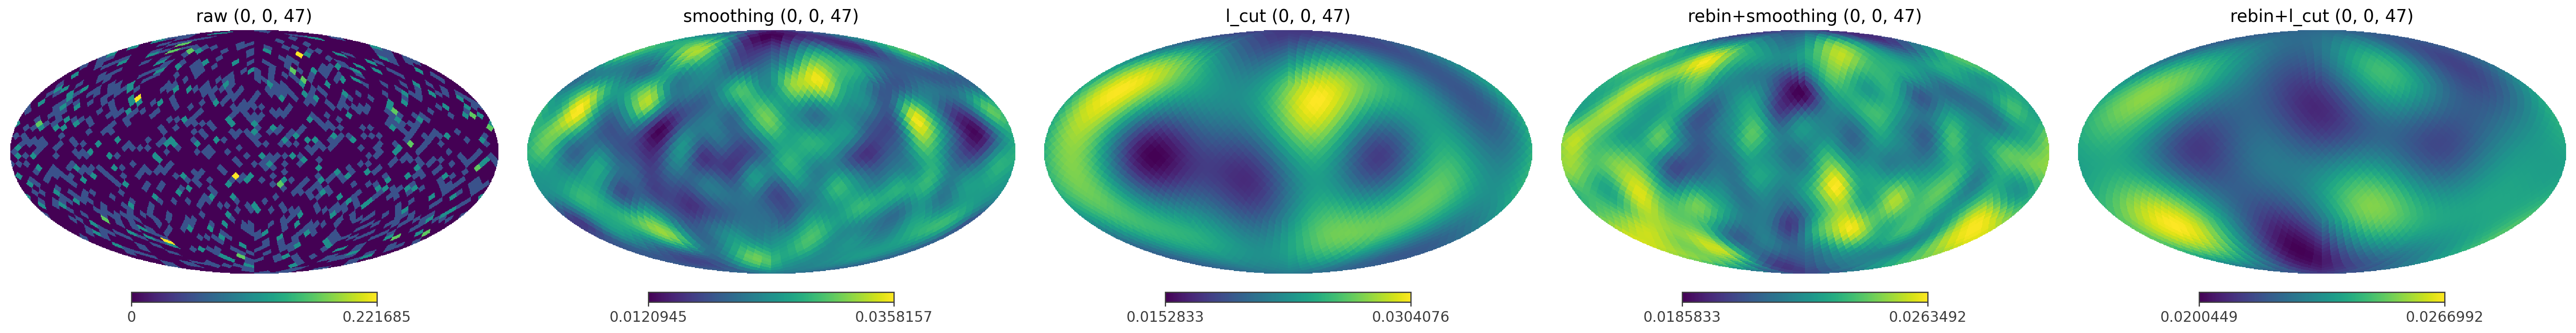
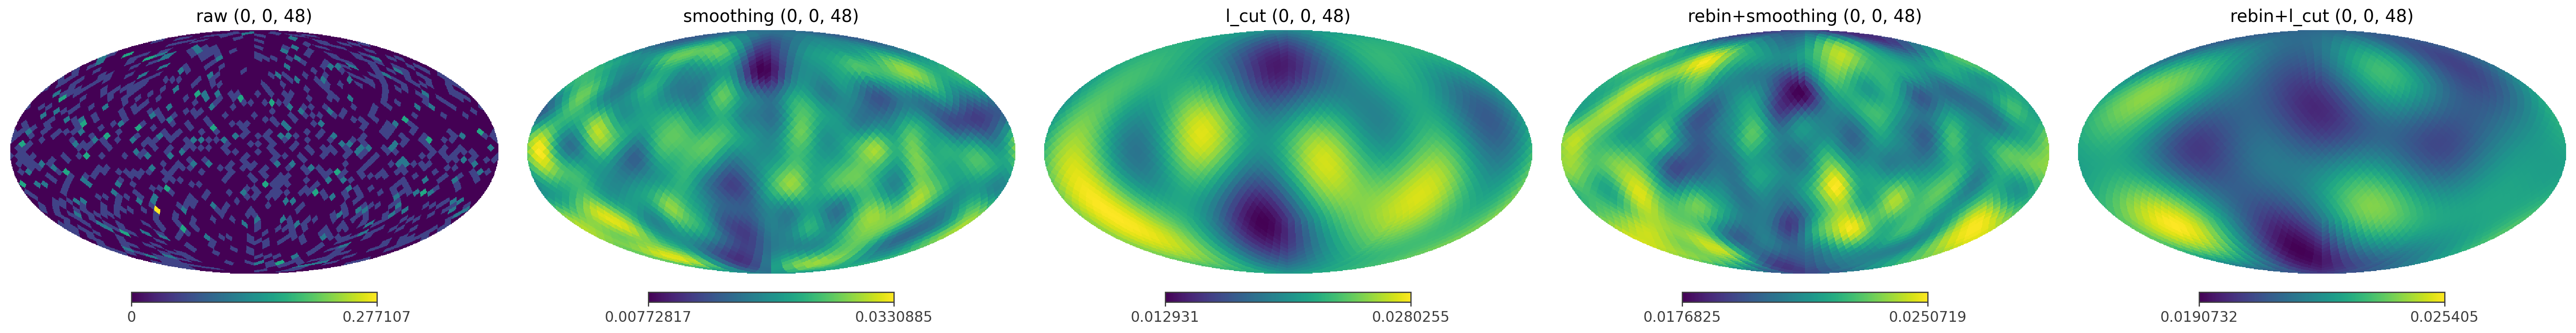
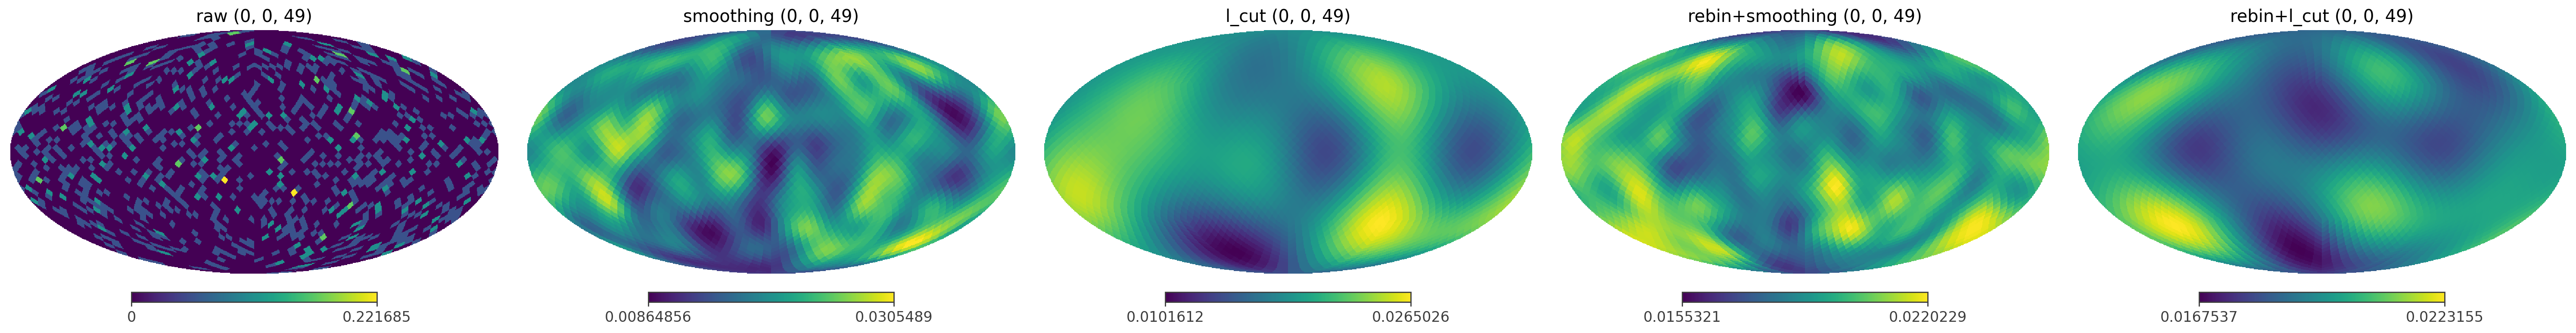
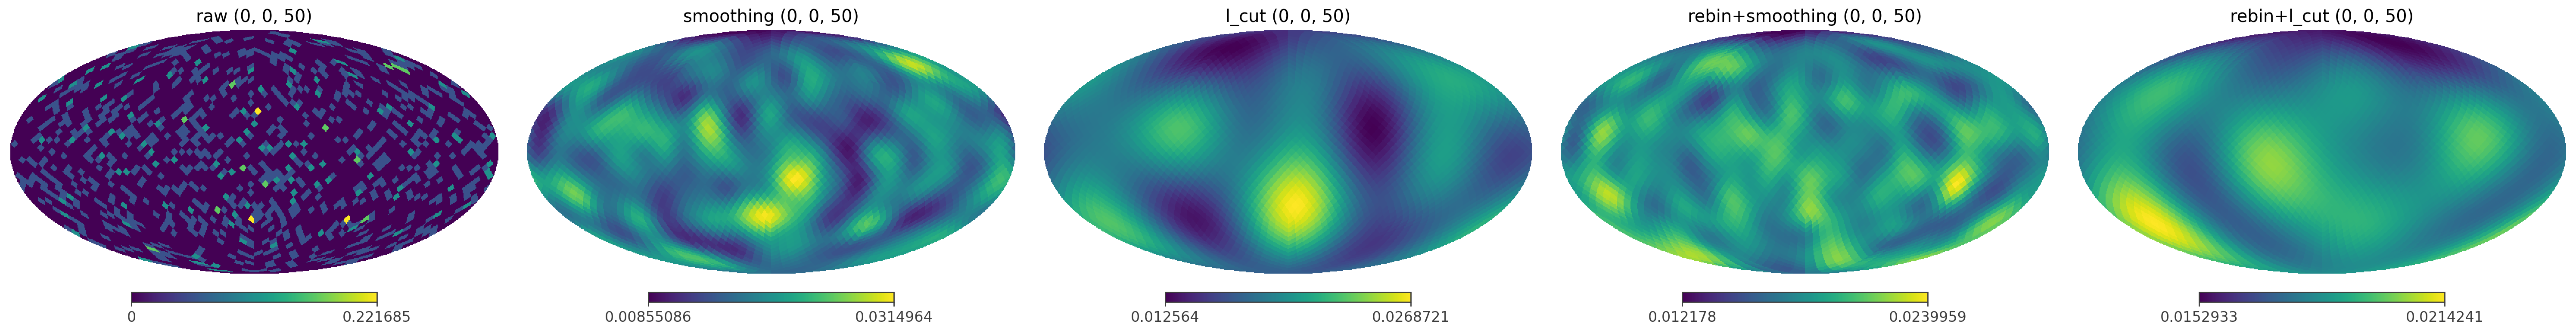
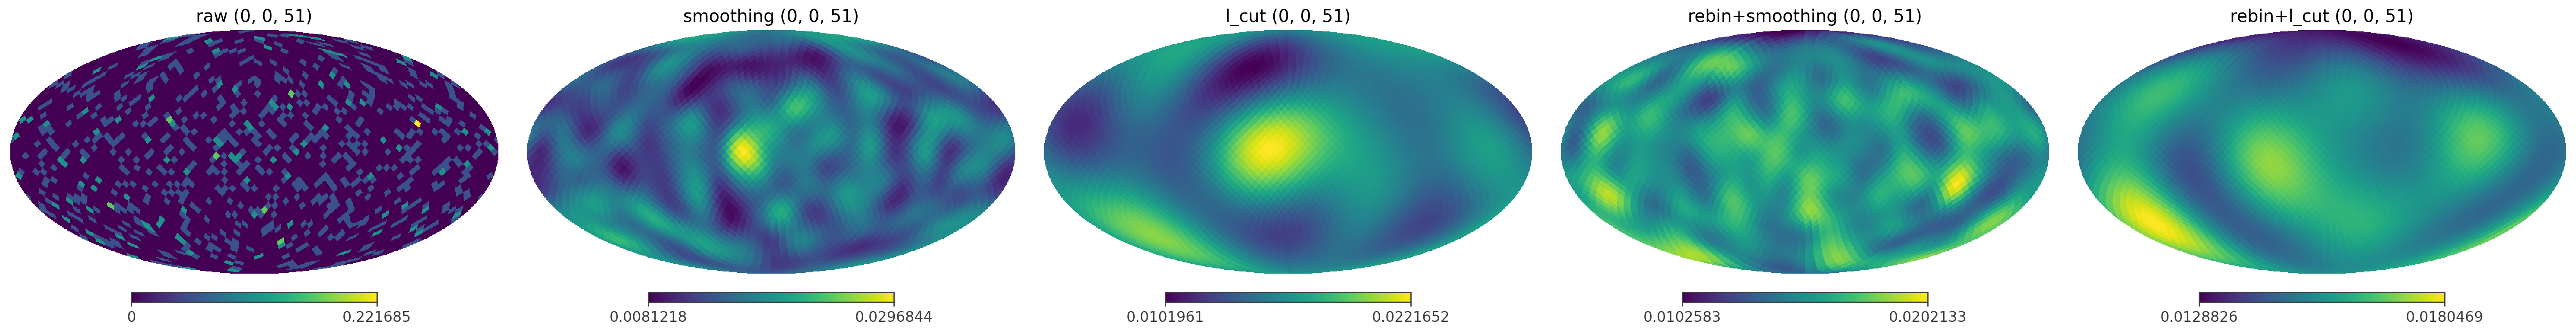
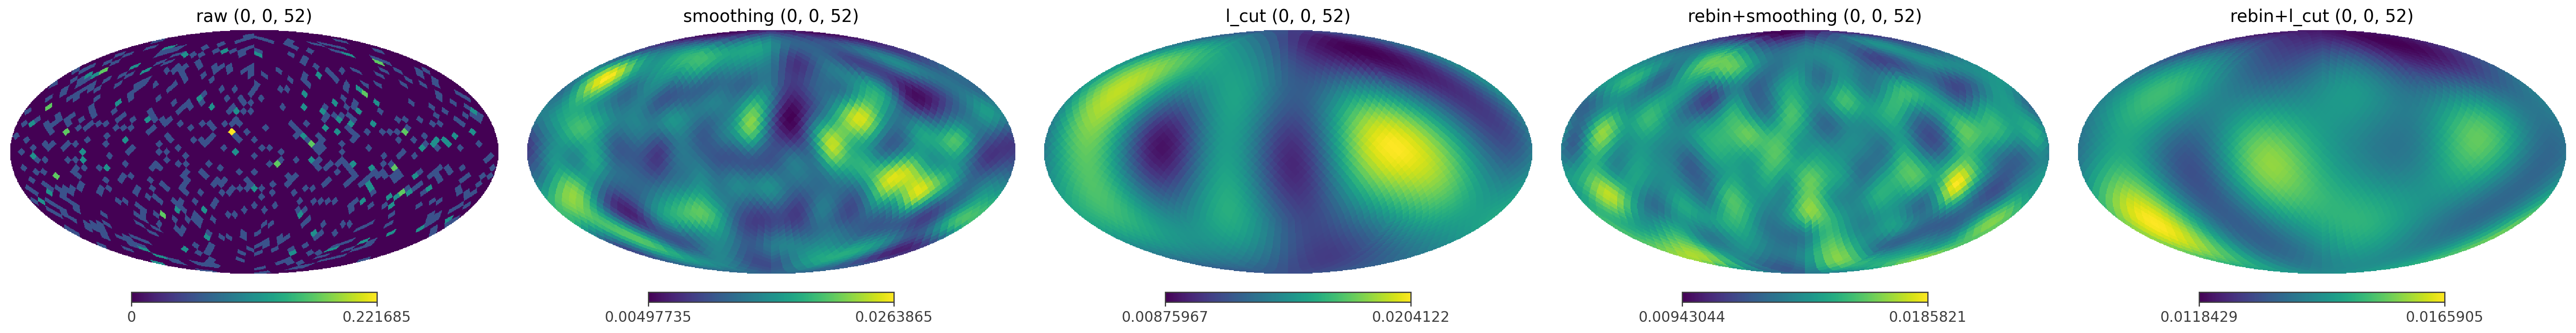
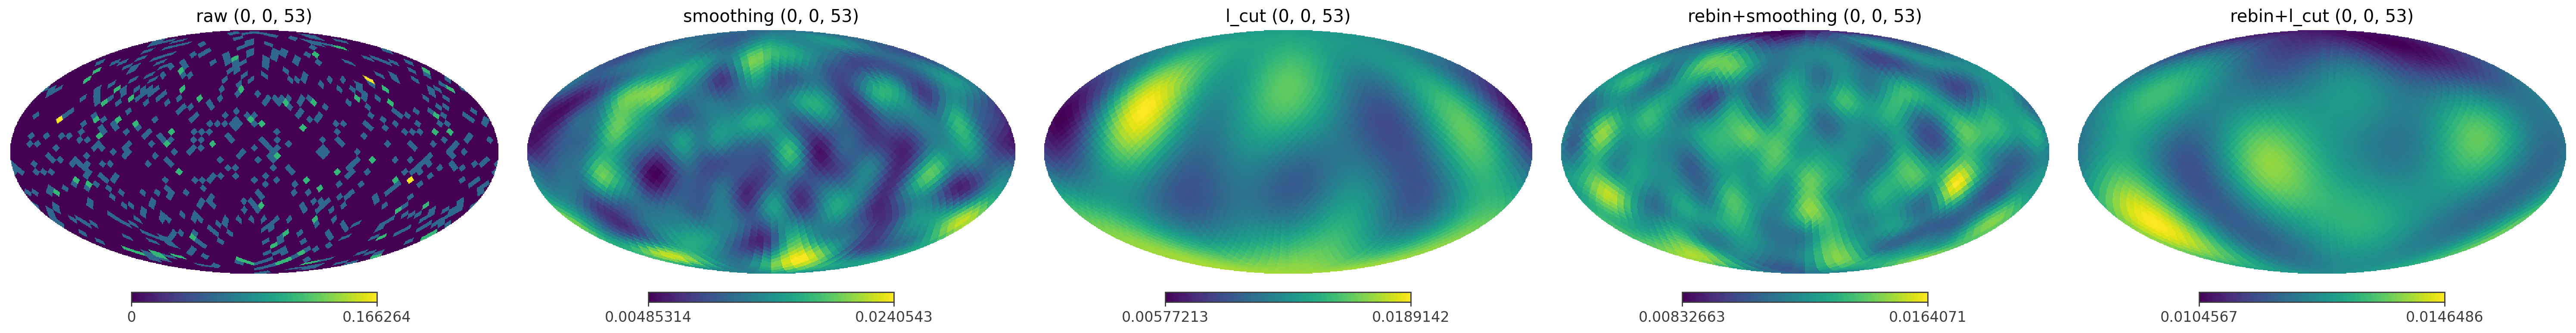
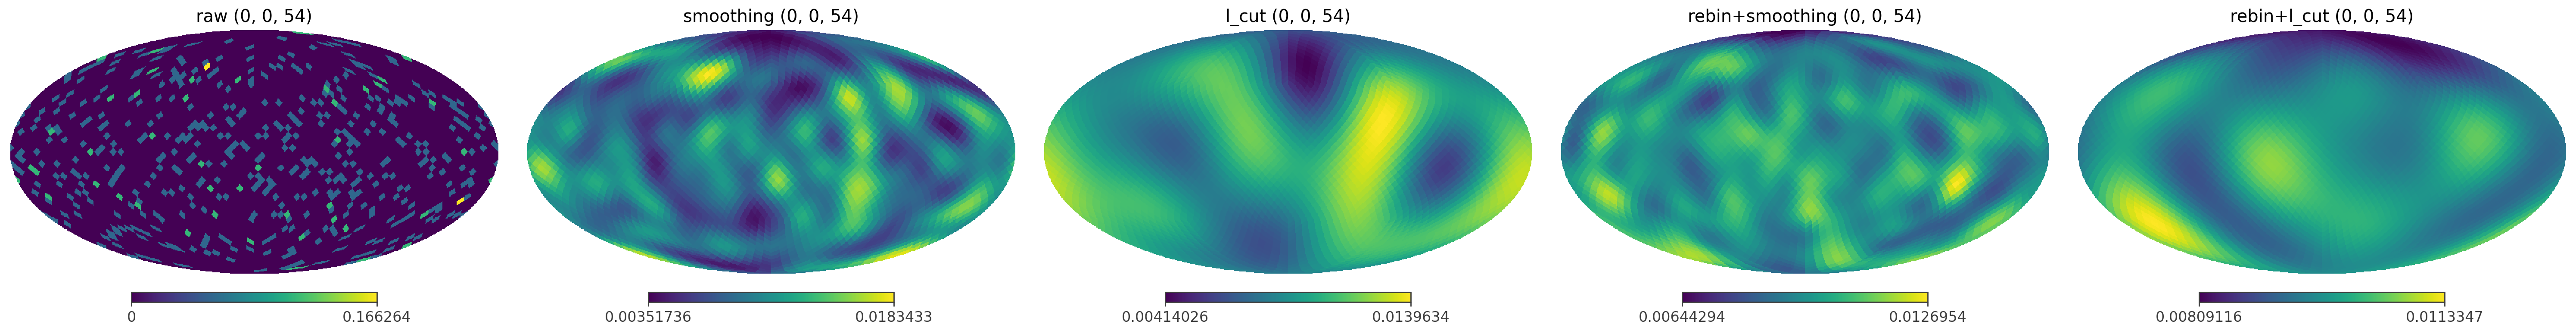
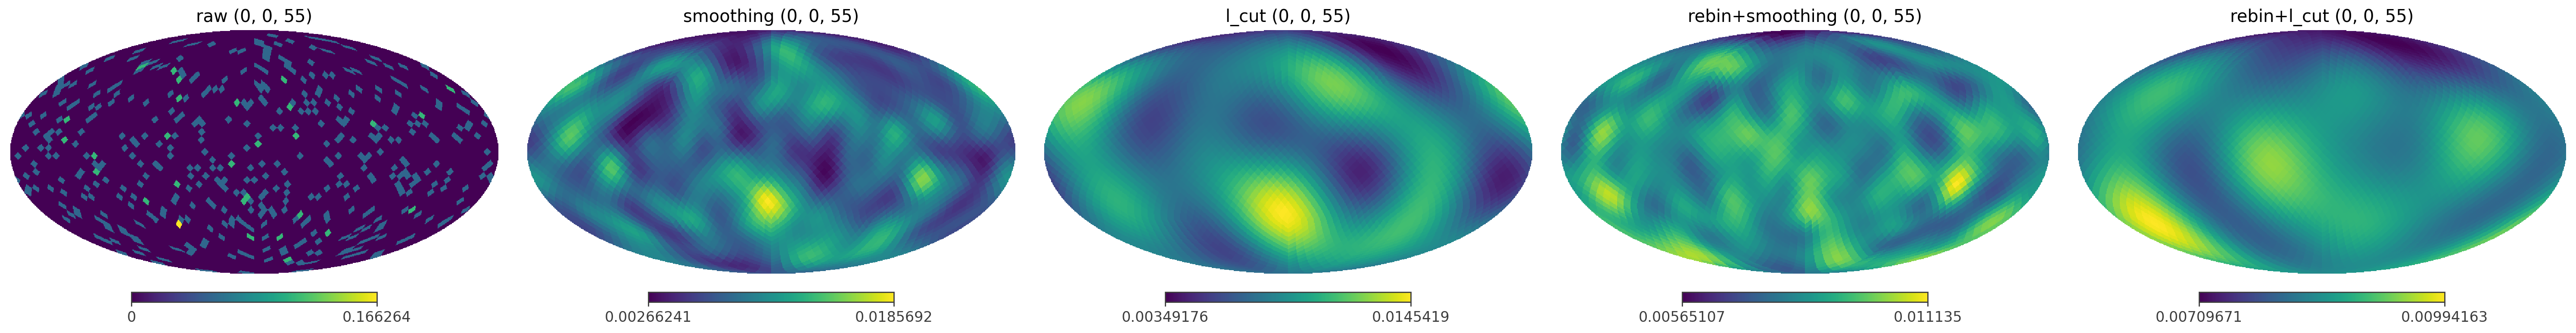
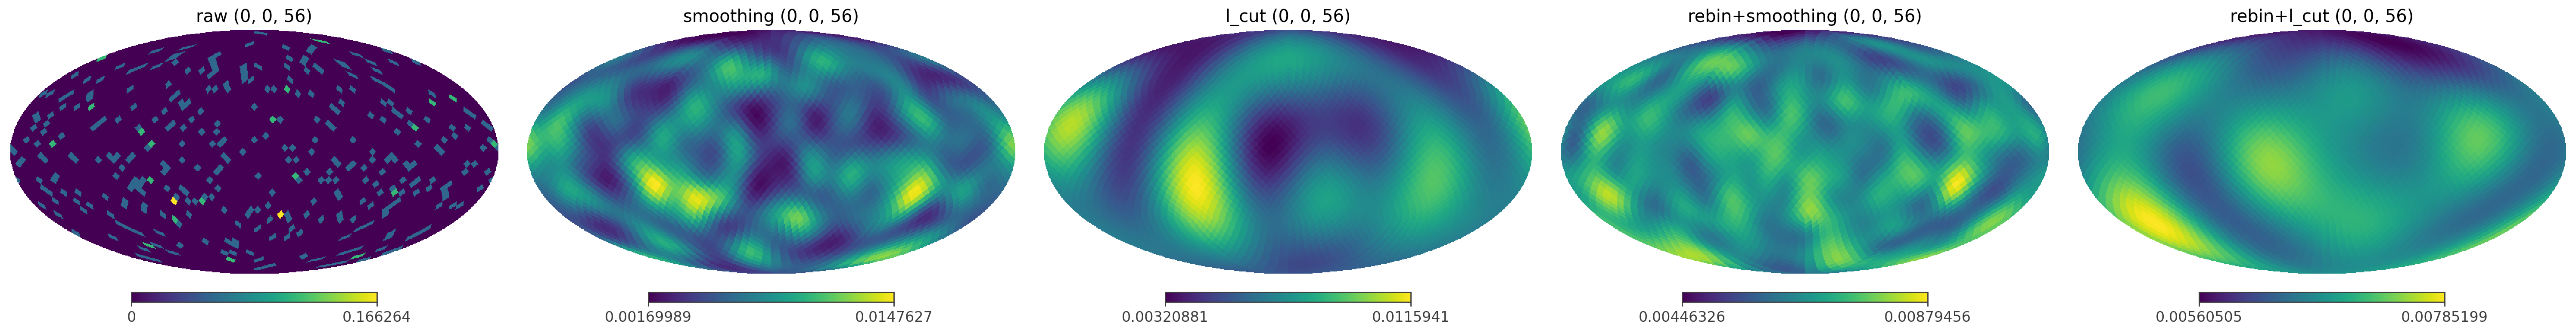
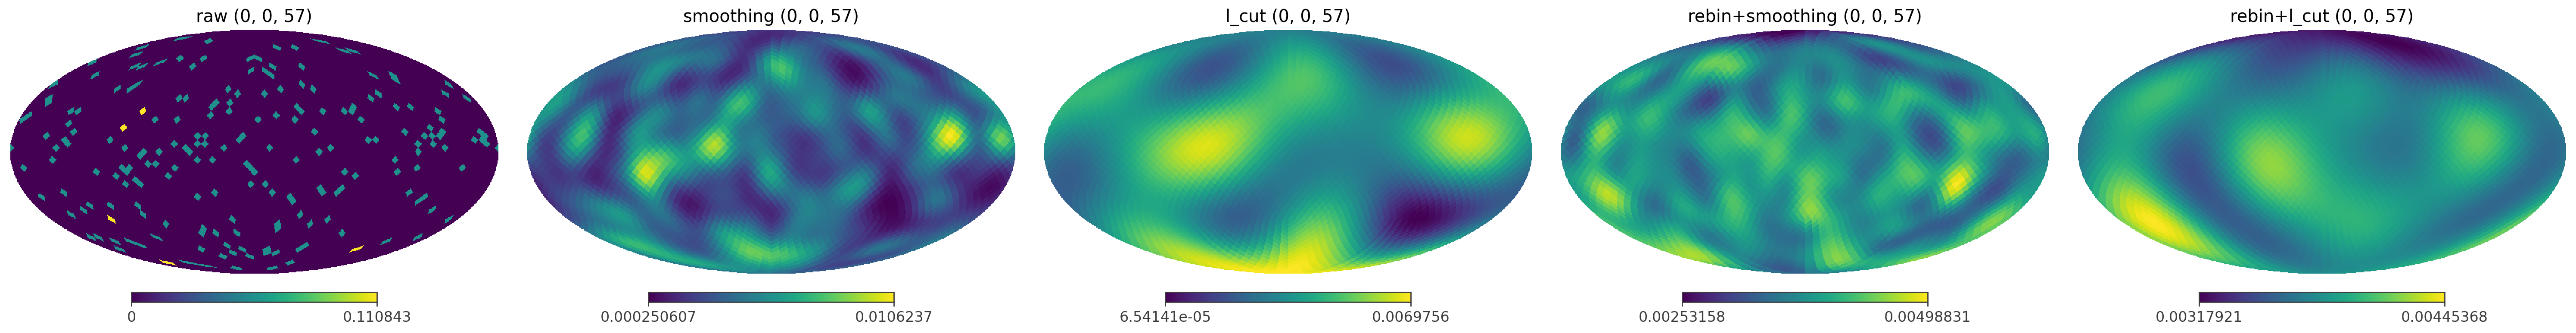
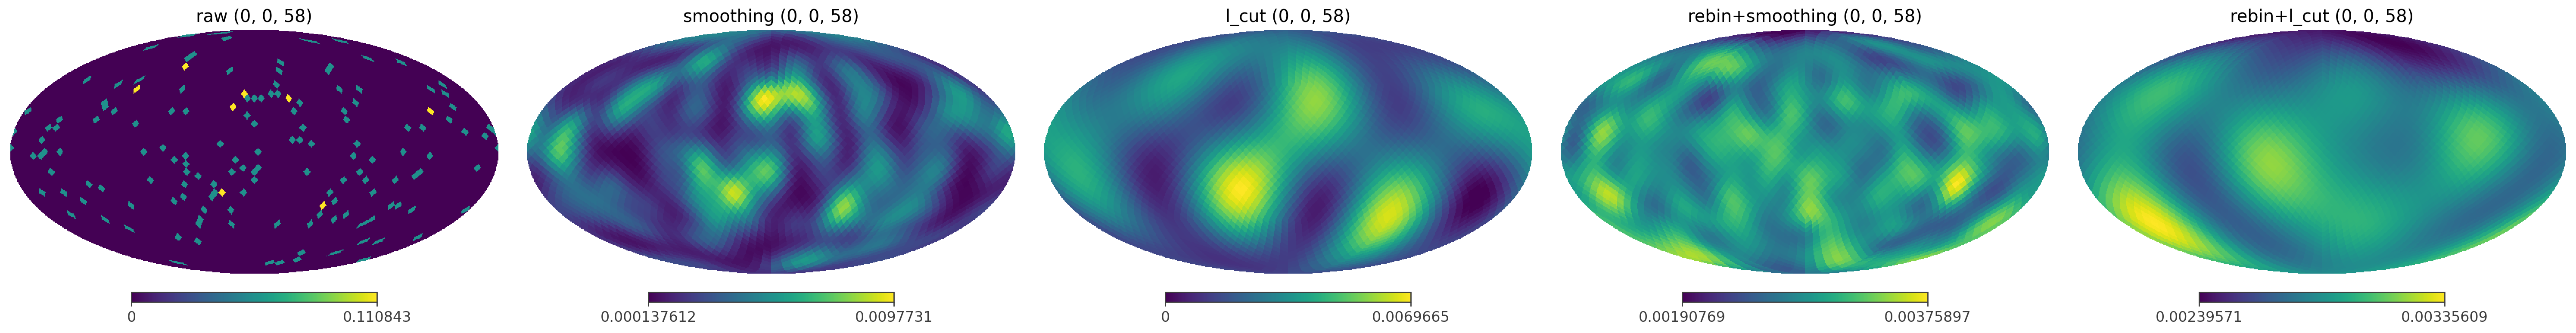
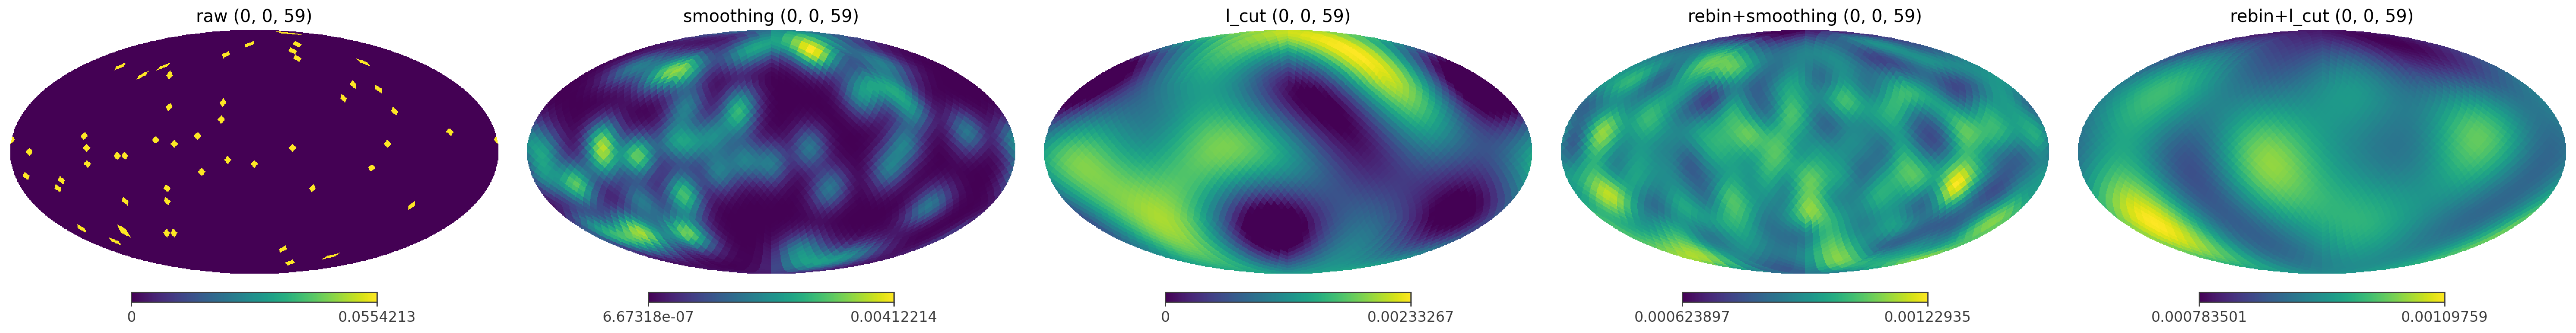
PsiChi maps (mollview)
[34]:
from itertools import product as iterproduct

for idx in iterproduct(*[range(s) for s in bkg_model_histogram.shape[:-1]]):
    n = len(models)
    fig = plt.figure(figsize=(6 * n, 4))
    for i, (name, model) in enumerate(models.items(), start=1):
        hp.mollview(model[idx], title=f'{name} {idx}', fig=fig.number, sub=(1, n, i))
    plt.show()
[ ]: